The U.S. Lowers Oil Volatility

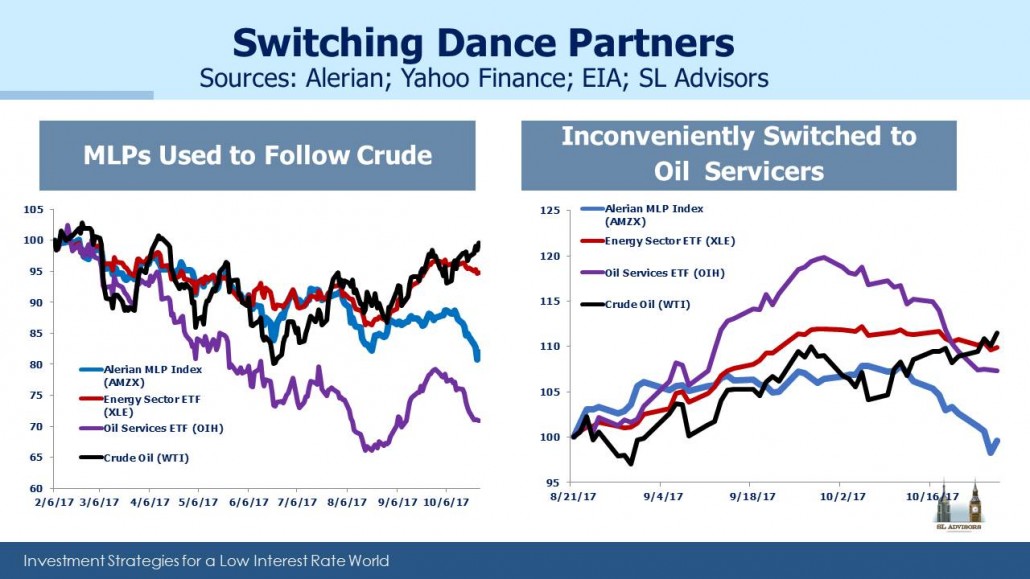
MLP investors are well aware that energy infrastructure securities move with crude oil, until that relationship inconveniently broke down during the Summer. Although we move and process far more natural gas (on an energy equivalent basis) than oil, investor sentiment causes the link. Because the economic link is weaker than sometimes implied by moves in the sector, the two can part company with little warning.

Some relationship makes sense, because pipelines and related infrastructure are typically built in anticipation of future demand. Commencing pipeline operations at 100% capacity is of course the best case, but more common is a steady ramp-up of utilization. The rate at which capacity gets used up can depend on production levels in the supplying region, and production is sensitive to price.

Before the Shale Revolution, U.S. crude oil production was heading steadily lower. Today, any forecast of U.S. output must be based in part on commodity prices. The correlation between the two is sometimes higher than it should be, but it’s no longer a commodity-insensitive business.

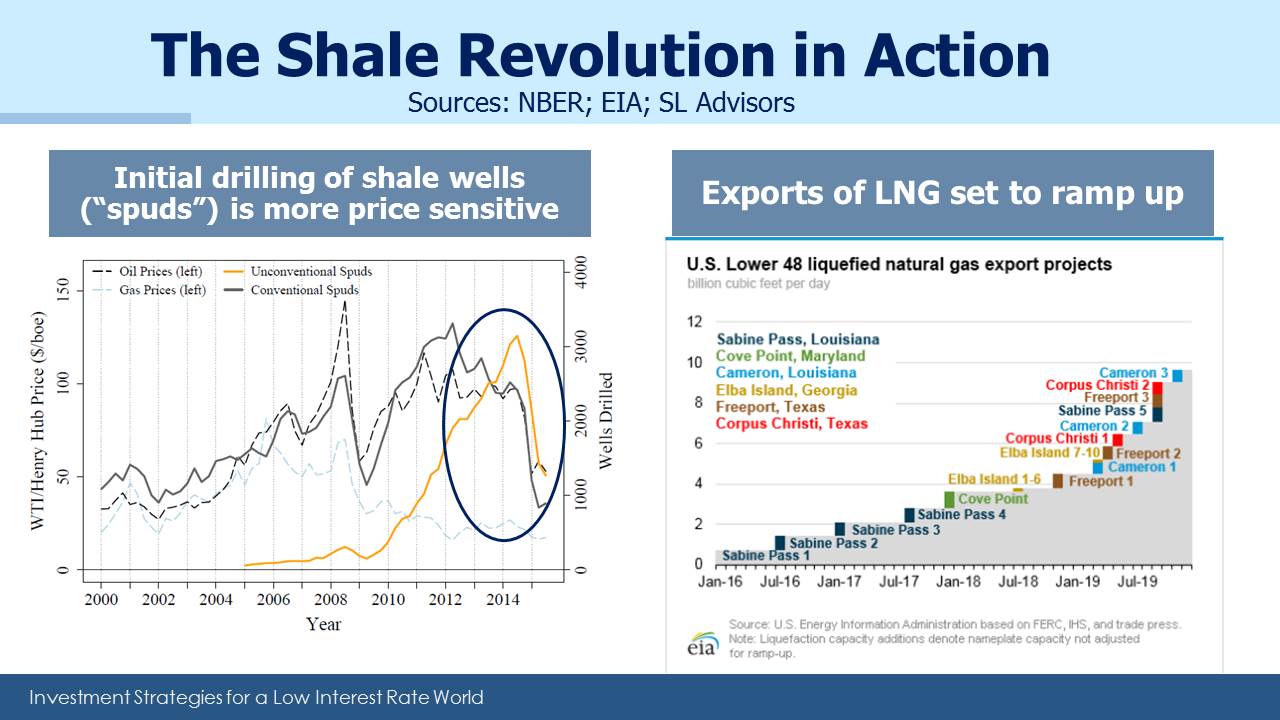
A recent report from the National Bureau of Economic Research (The Unconventional Oil Supply Boom: Aggregate Price Response From MicroData) seeks to measure the sensitivity of U.S. oil production to price. Among their conclusions is that unconventional drilling is up to six times more responsive to prices than conventional. This is because shale projects are “short-cycle”; the payback time is far shorter. Shale drillers can hedge enough of their expected output to ensure an adequate return, not just because upfront expenses are comparatively low but also because initial production rates are high, relative to conventional wells (see Why Shale Upends Conventional Thinking). Exxon Mobil’s CEO Darren Woods commented earlier this year that a third of their capex budget was dedicated to short-cycle opportunities. It’s because they’re less risky. Conventional projects have far longer payback periods, exposing them to the vicissitudes of prices.

The growing importance of short-cycle projects has a couple of other implications for crude oil. One is that it should reduce market volatility. The greater responsiveness to price of shale production means that supply/demand imbalances are more smoothly corrected. NBER doesn’t go as far as to classify the U.S. as the swing producer (which they define as one able to react within 30-90 days), because such adjustments still take several months. But we clearly have a more sensitive supply response function than in the past. Oil prices are becoming less volatile, as we suggested might happen (see U.S. Oil Output Continues to Grow).

NBER’s conclusions include an additional insight, which is that production from unconventional wells is less variable. Not only do you get your capital investment returned more quickly, but you have greater certainty around output. In combination, these two aspects of shale should lead to lower required returns on capital. All of this is to the enormous benefit of the U.S., since shale drilling is almost exclusively an American phenomenon.

Crude prices have been rising as OPEC’s production curbs gradually take effect. Their decisions will continue to significantly impact prices. But another consequence of shale could be gradually rising prices. NBER estimates that a rise to $80 a barrel would stimulate an additional 2 million barrels a day (MMB/D) of U.S. production within two years. Investing in conventional oil and gas projects has been falling, and it’s generally accepted that we need to produce an additional 4-5 MMB/D annually to offset depletion of existing fields as well as meet new demand. U.S. shale may be part of the solution but the figures above show that other sources will need to provide the lion’s share. Earlier this year Goldman Sachs forecast that at $75 a barrel U.S. production would exceed 20 MMB/D. Cleatly there’s enormous variations in forecasts, and NBER may be overly conservative.

.avia-image-container.av-2mev0t-b25337aa4b9730289ee5db847df668ea img.avia_image{ box-shadow:none; } .avia-image-container.av-2mev0t-b25337aa4b9730289ee5db847df668ea .av-image-caption-overlay-center{ color:#ffffff; }

Therefore, gently rising crude oil prices are the most likely outcome. This can only be good for U.S. energy infrastructure. Meanwhile, Liquified Natural Gas exports are set to increase sharply. The constructive analysis on crude oil prices doesn’t apply as readily to natural gas, because global LNG trade volumes are benefiting from several new sources of supply. But as one of the lowest cost producers, the U.S. is in good shape here as well.


The GOP House Tax Bill Implications

Yesterday we received the first details on tax reform as the House Republicans unveiled their plan. To residents of high-tax states (including your blogger in NJ) it looks like the Republican Tax Hike Plan. Putting aside the impact on some individuals, our thoughts on the investment consequences are as follows:

MLP investors should benefit, because the structure is untouched and we interpret the plan as allowing the 25% business owner pass-through rate to apply to taxable income, rather than ordinary income tax rates. This is more valuable the higher your income. Around 80% of MLP distributions are tax-deferred, and many long-time MLP holders are familiar with receiving a large tax bill when they sell, since taxes on distributions that were deferred are owed at that point. Former Kinder Morgan Partners (KMP) investors are acutely aware of the unwelcome tax bill they received back in 2014 when Kinder Morgan Inc (KMI) acquired KMP’s assets, simplifying their corporate structure but triggering the above mentioned tax event. Under the House proposal, if that was to happen in 2018 the KMP tax bill would be based on the 25% pass-through rate. This will be a consideration for those MLP businesses considering simplification transactions in which the GP buys the MLP, since the acquiring GP won’t have to offer as much consideration to the MLP holders given the likely reduced tax burden.

We didn’t see anything else that was negative for MLPs, notwithstanding the weakness in the sector following release of the plan.

The other items related to corporate taxes affect most corporations, not just those in energy infrastructure. The lower tax rate is obviously good – how good depends on your tax rate. Energy infrastructure businesses generally pay a lower rate than 35% because they have substantial non-cash depreciation charges. By contract, companies in the Consumer Staples sector (which figures prominently in our Low Vol strategies) are generally paying corporate taxes at close to the 35% rate. Those taxed at higher rates will obviously benefit more from a new, lower 20% corporate rate.

Interest expense is capped at 30% of EBITDA (Earnings Before Interest, Taxes, Depreciation and Amortization). So a company with $1MM of EBITDA could deduct up to $300K of interest expense. Assuming they were borrowing at 5%, this would allow them to borrow up to $6MM (i.e. 5% interest on $6MM is $300K) and still deduct the expense. A Debt:EBITDA leverage ratio of 6:1, as in this example, is higher than most energy infrastructure businesses, where 4X-5X is more typical and is coming down. Clearly, if rates were higher this would reduce the amount of tax-deductible debt. A 10% cost of borrowing would impose a 3X Debt:EBITDA tax-deductible leverage limit – probably not a bad idea at such high rates anyway. Faster depreciation schedules may further reduce taxes for some companies, and energy infrastructure businesses are likely beneficiaries.

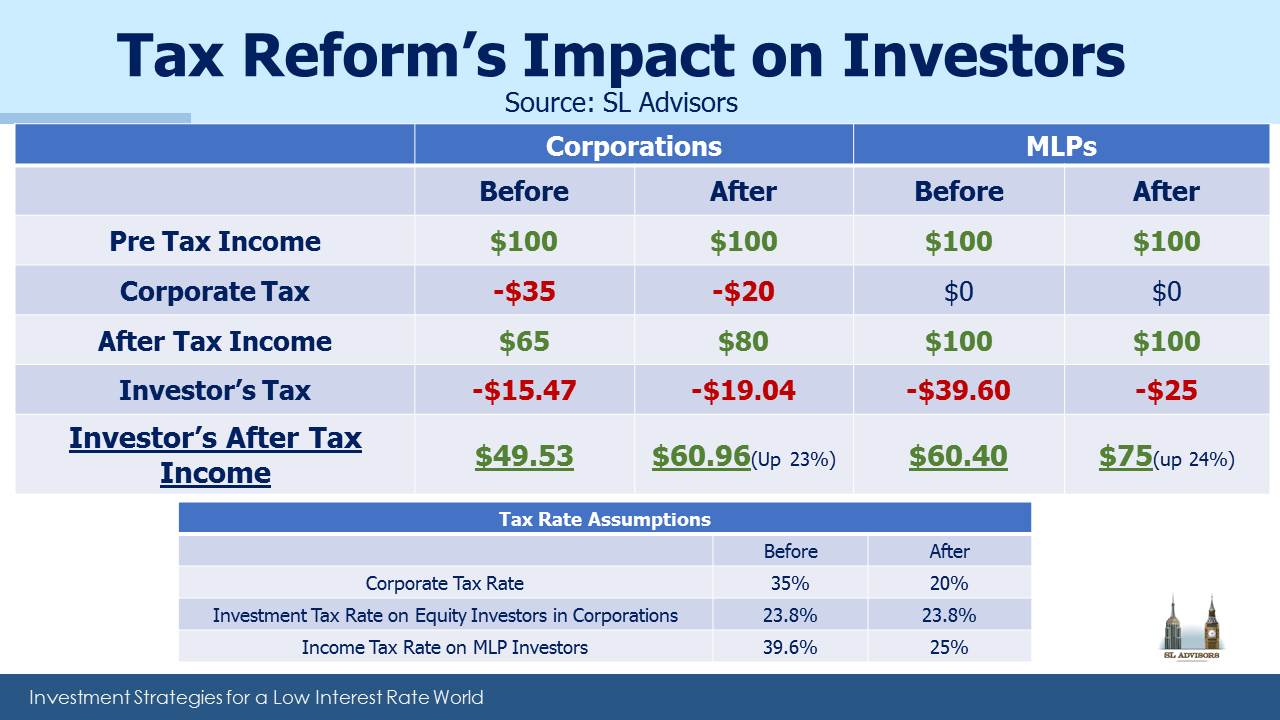
In April we offered our thoughts on proposed tax reform (see MLPs and Tax Reform). Below is an updated table comparing the impact on energy infrastructure C-corps and MLPs. Tax reform is beneficial to both classes of investment.

.avia-image-container.av-35gy3t-9eeea3284de5d2b35475d9e535324aab img.avia_image{ box-shadow:none; } .avia-image-container.av-35gy3t-9eeea3284de5d2b35475d9e535324aab .av-image-caption-overlay-center{ color:#ffffff; }

The lower corporate tax rate on its own reduces the tax advantage of MLPs versus C-corps. But the pass-through 25% tax rate on distributions when taxable is an improvement for investors. So we don’t see anything here that renders the MLP structure less attractive. C-corps in the energy sector today aren’t anywhere near the 35% rate. Since taxes on investment income (qualified dividends and capital gains) aren’t changing, a lightly taxed C-corp might be less tax-efficient (since its dividends are taxable) than an MLP where the investor can benefit more than the corporation from the tax-deductible depreciation. In short, MLPs can still be advantageous.

The main problem for the structure this year has been an evident unwillingness of traditional MLP investors to provide growth capital (see The Changing MLP Investor and More on the Changing MLP Investor). Maybe the more attractive tax treatment to investors will help.

We are invested in KMI


The American Energy Independence Index

The U.S. energy sector has undergone dramatic changes over the past five years. Hydraulic fracturing (“fracking”) and horizontal drilling have roiled global energy markets. America has shifted from planning to import Liquefied Natural Gas (LNG) to exporting it, with LNG exports expected to more than quadruple over the next three years. Cheap domestic methane has made natural gas the biggest single source of electricity in the U.S., in the process supplanting coal and unexpectedly helping reduce CO2 emissions. Increasing production of Natural Gas Liquids (NGLs) such as ethane are behind close to $200BN of investments in new petrochemical facilities. Propane exports are up five-fold in five years.

In late 2016 OPEC was forced to abandon its strategy of trying to bankrupt U.S. shale oil producers with low prices, because production fell less than needed and many OPEC countries faced gaping budget holes with little to show for it (see OPEC Blinks). Almost 40% of the world’s oil producing nations had tried and failed to kill off the Shale Revolution. American free enterprise triumphed.

The dramatic increase in hydrocarbon production represents one of the greatest examples in recent years of the power of American private sector capitalism. Technological ingenuity and constantly improving productivity allowed costs of production to keep falling. The world’s biggest capital markets provided funding to support a culture of entrepreneurialism and new business formation. Highly developed energy infrastructure networks and a skilled energy labor force were already in place, and other natural resources such as water were conveniently available. Lastly, privately owned mineral rights, a global rarity, allowed individual landowners to profit from the Shale Revolution by signing drilling leases with energy companies. In short, the Shale Revolution leveraged all that’s great about America’s form of capitalism (see America Is Great!).

The changes have been so dramatic that they’re leading us to American Energy Independence. Among the many changes are the positioning of the energy infrastructure business. For years, pipelines were synonymous with reliably stable cashflows that grew modestly and required minimal reinvestment. An entire class of investment, Master Limited Partnerships (MLPs), evolved to provide tax-advantaged exposure for those willing to handle K-1s at tax time rather than 1099s. Over $50BN was raised for deeply flawed mutual funds and ETFs that provide 1099-type MLP exposure while incurring a heavy additional tax burden (see Some MLP Investors Get Taxed Twice).

Energy infrastructure is key to American Energy Independence. Steadily increasing volumes of hydrocarbons are leading to increased investment in infrastructure. Traditional sources of crude oil, such as the Permian in West Texas, are producing more than ever even after almost a century of output. More recent discoveries such as the Marcellus Shale in Pennsylvania are producing substantial volumes of natural gas where little production existed a decade ago. Although the “toll-model” of pipelines, storage assets and processing facilities still thrives, the long-term growth opportunities in infrastructure are attracting investors willing to reinvest cashflows back into accretive projects.

As a result, energy infrastructure businesses are evolving beyond MLPs, as their need for capital has not always aligned with traditional, yield-oriented MLP investors. Simplification, in which an MLP and its General Partner merge into a single corporate entity, has broadened the investor base. MLPs are nowadays an important but shrinking portion of the opportunity set.

The secular theme of American Energy Independence reaches beyond MLPs, and this is why we’re launching the American Energy Independence Index. It’s designed to incorporate those infrastructure businesses that are critical to supporting our growing energy needs. It includes both MLPs and corporations; some large Canadian companies as well as American ones, since infrastructure is highly integrated between the U.S. and Canada. In fact, the market capitalization of the corporations in the index is $300BN, approximately the same as the Alerian MLP Index. Those investors who seek energy infrastructure exposure via MLPs are limiting themselves to a steadily shrinking subset of the relevant companies. Energy infrastructure today is about growth, and many large businesses have adopted a traditional corporate structure so as to attract global investors, rather than simply those wealthy Americans who will accept the complexity of K-1 tax reporting.

Moreover, investing in MLPs via mutual funds or ETFs usually comes with the substantial tax drag noted above (see Are You in the Wrong MLP Fund?).

The American Energy Independence Index is designed to track the companies of our energy future. The Shale Revolution is bringing the U.S. closer to energy independence. Increasing volumes of hydrocarbons need to be gathered, processed, transported and stored, all of which requires additional infrastructure.

Today the index is almost fully infrastructure supporting oil, natural gas, refined products and NGLs, because those reflect our energy mix and offer reliable cashflows. Hydrocarbons will remain the dominant source of our energy for the foreseeable future, and the index consists of energy infrastructure offering consistent economic returns over the long term. This excludes coal, since it moves by rail and ship where barriers to entry are lower, and so it is not included in the index. Although the transportation and storage of renewable energy isn’t a business today, as these technologies mature and their infrastructure begins supporting similarly stable cashflows, their place in the index will grow. The American Energy Independence Index is designed to evolve with America’s changing energy needs. It is biased towards energy infrastructure that provides reliable cashflows growing over the long term.

Since 2010 the American Energy Independence Index has reflected the performance of the broader energy infrastructure sector. It has moved with the Alerian Infrastructure Index but has performed better because it’s not limited to MLPs. It better reflects the future of financing infrastructure, which still uses the MLP vehicle but relies on it less than in the past. Almost all the ETFs and mutual funds in the sector focus too narrowly on MLPs, instead of covering the entire universe of energy infrastructure opportunities.

In a few weeks we will be making available an opportunity to invest in the index. We think it represents a superior way to participate in our energy future, as America heads towards Energy Independence.

.avia-image-container.av-1tl1wi-9d06f7c53ba5477c219e6257dcc20bc9 img.avia_image{ box-shadow:none; } .avia-image-container.av-1tl1wi-9d06f7c53ba5477c219e6257dcc20bc9 .av-image-caption-overlay-center{ color:#ffffff; }

Disclosures:

References to indexes are hypothetical illustrations of aggregate returns and do not reflect the performance of any actual investment. Investors cannot invest in an index and do not reflect the deduction of the advisor’s fees or other trading expenses. Actual realized returns will depend on, among other factors, the value of assets and market conditions at the time of disposition, any related transaction costs, and the timing of the purchase. The Index’s performance does not represent the results of actual trading, but was achieved by means of retroactive application of a model designed with the benefit of hindsight. Results may not reflect the impact that material economic and market factors might have had on adviser’s decision-making if adviser were actually managing client assets.


The Tumult in MLPs

If the recent violent sell-off in energy infrastructure stocks has you puzzled, you have plenty of company. That’s why Sunday’s blog is going out early, because we’ve been discussing it with so many people. We enjoy a regular dialogue with many of our investors and last week was the busiest we can recall in responding to clients.

Many wanted to understand why MLPs had followed crude oil lower earlier in the year but failed to mimic its recent recovery. It’s easy to sympathize. A bullish view on oil was almost a prerequisite to committing capital to the sector in the first half of the year. Never mind that linking MLP operating performance to oil is in most cases futile. Their stock prices and oil did move together for months, until that correlation broke down most inconveniently as oil rose.  Investors feel duped.

.avia-image-container.av-2etdbw-5efb735be3bbd8418f5a38ff8faae22b img.avia_image{ box-shadow:none; } .avia-image-container.av-2etdbw-5efb735be3bbd8418f5a38ff8faae22b .av-image-caption-overlay-center{ color:#ffffff; }

Many callers were looking for confirmation that they’re not missing something, so absent were compelling explanations. Is it tax reform? Little detail is known, but the Administration has proposed allowing owners of partnerships to pay taxes at newly reduced corporate rates rather than the higher ones on income (see MLPs and Tax Reform). And anyway, the MLPA is well practiced at lobbying against adverse tax changes.

Perhaps investors are looking ahead to declining global crude oil demand? It’s a long way off and in any case US output looks set to exceed it previous high of 10 Million Barrels per Day next year, eclipsing a record set in 1970.

Is shale output peaking? The rig count is growing but more slowly. But looking across a broad selection of exploration and production companies, capex plans for 2018 don’t show much sign of retrenchment.

Tax loss selling was suggested by some — energy stocks offer many of the rather limited opportunities this year to sell at a tax-deductible loss. As MLP investors are painfully aware, the stock market has been registering new all-time highs seemingly every week. Hedge fund selling was certainly cited in some quarters, but there are a lot of hedge funds and they’re always buying and selling.

BP’s IPO of its refining business was probably responsible for some selling as investors created room by liquidating other positions. We didn’t participate and it doesn’t look as if we missed an opportunity since it quickly traded below its initial pricing.

Enterprise Products (EPD) used an announced future buyback to redirect cashflow back into new projects (see Why Don’t MLPs Do Buybacks?). It’s reflective of the shifting financing model. An Energy infrastructure sector with opportunities to reinvest in its business is redirecting cash from payouts to capex. It’s disillusioning to the income-seeking investor but is a sensible move if the returns are attractive. The continuing shift from income-seeking to growth-oriented investors is disruptive (see The Changing MLP Investor and More on the Changing MLP Investor), and is a major theme driving recent returns.

Energy Transfer Partners (ETP) yields over 13%. It’s a safe bet that a year from now its yield will be lower, either because the investor skepticism such a yield demonstrates is proven correct and it’s cut, or because buyers scoop up the stock and drive the yield lower. Yesterday, in an act of willful defiance aimed at the skeptics, Energy Transfer raised the dividend both on the GP, Energy Transfer Equity (ETE), and ETP.

Investing usually involves making a decision with adequate information but not all the knowledge one might like. There’s consequently a certain paranoia that, when things don’t go as expected, it’s because others (usually those selling) had some insight overlooked by the buyer. This can be a valuable self-protective instinct. The trader who concludes he knows all that’s needed to trade profitably is usually an ex-trader before too long. Many clients were explicitly or implicitly worried that this might be the case.

But while a certain amount of paranoia can be useful, it’s not always correct that a mark to market loss proves an analytical oversight. We continue to scour for tangible justifications behind the recent move, so far with limited success. We’ve talked to investors in the last week who are buying, holding and selling. The first two are easy to justify on valuation terms even though it takes a brave soul to risk capital under current circumstances. But the sellers we’ve chatted to know little more than the first two categories. What they do know is that they’ve had enough. They feel aggrieved that a correctly constructive view on oil prices has been destructive. They are tired of their clients asking why, in such a buoyant equity market, they own stocks that are falling. They’re fed up with missing the action. Maybe valuations are compelling but they’re no longer of a mind to wait for other buyers to act on this. They don’t possess more facts than the buyers, they’ve simply run out of patience.

It’s a pity, and will probably look like an emotional decision over the long run. But it sure felt good earlier in the week, and may well look brilliant following another week of selling.

Market timing is rarely easy, and so we remain invested because valuations are more attractive in energy infrastructure than any other sector. Don’t use leverage. Pick companies and sectors with strong balance sheets. This enables waiting out the inevitable swoons that over-managing positions causes.

We are invested in EPD and ETE


Why Don’t MLPs Do Buybacks?

Ten days ago Enterprise Products (EPD) announced that they may in the future initiate a buyback of units, perhaps in 2019. Bigger news was the moderation in the growth rate of their distribution, so the buyback received less attention. But it highlights an interesting fact about MLPs, which is that they rarely do buybacks.

Part of the reason is taxes. Companies in the S&P500 in aggregate return only 42% of their profits in the form of dividends. From a purely tax-efficiency standpoint they shouldn’t pay dividends at all – profits are subject to corporate tax and then the holder has to pay tax on the dividend income. The distortion caused by taxes means that corporations that pay dividends deprive investors of the benefit of deferring taxes, which they could do if companies fully relied on buybacks to return capital. In this way, investors could choose when to realize a portion of their investment and incur the corresponding tax liability. Don’t expect this to change anytime soon though.

By contrast, distributions paid to MLP investors don’t determine their taxes; Buy and hold MLP investors pay taxes on their proportionate share of the profits of the business, regardless of the distributions received. Because MLPs themselves aren’t taxed, there’s no double taxation of profits to owners. For years the market rewarded steadily rising dividend payments, and so MLPs paid out the substantial majority of their Distributable Cash Flow (approximately equivalent to Free Cash Flow less Maintenance Capex) and raised new equity when they needed capital. Since distributions paid to MLP investors aren’t tax-inefficient, there’s little need for MLPs to use buybacks to return extra cash to investors. Moreover, in the GP/MLP structure in which the GP operates like a hedge fund manager (see MLPs and Hedge Funds Are More Alike Than You Think), buybacks might lower the payments received from Incentive Distribution Rights (IDRs), as IDRs are determined both by the level of dividend paid as well as the number of LP units outstanding. So MLPs don’t do buybacks – they generally pay out most of their cashflow and typically issue new equity for new projects.

Except now, EPD has announced they may initiate buybacks, reflecting another development in the shifting financing model for energy infrastructure. Traditional MLP investors (i.e. the wealthy, taxable Americans who are willing to deal with K-1s) have turned out to be an unreliable source of new capital. They like their distributions but they don’t like reinvesting them through secondary offerings or IPOs. This relative tight-fistedness has exposed the comparative largesse of MLPs in distributing most of their cashflow at a time when the Shale Revolution has created opportunities to put it back into their businesses. This is why many large MLPs have concluded that the structure doesn’t work if you need to raise a lot of money.  Kinder Morgan was the first to pursue “simplification”, which by now is understood to result in reduced payouts, freeing up more cash for investing in new projects and therefore less need to issue equity at high yields.

The point of having a public equity listing is to be able to raise capital. The 7.6% yield on the Alerian Index doesn’t entice investors as much as it should because they suspect further simplifications. But for MLPs, it still represents an unreasonably high cost of financing.

EPD is conservatively run, and a reduced growth rate in their distribution is a modest step to redirect capital internally so as to lessen their need to raise money externally. It’s simplification-lite. Intriguingly though, rather than boost the growth rate back up in a couple of years, they may buy back units. Stable distributions are highly prized and even the best run businesses want to shield investors from variability in profits with highly predictable payouts. EPD is introducing greater capital flexibility, since buybacks are never guaranteed. They’re adopting one feature of a C-corp (lower payout ratios) while retaining the tax-efficient MLP structure.

An interesting debate is whether the large MLPs abandoned the investor (as holders of Kinder Morgan Partners certainly felt) or whether the MLP investors abandoned MLPs (as demonstrated by persistently high yields). Simplification transactions and more minor changes such as EPDs are all a result of MLP investors not wanting to reinvest their cashflows as eagerly as their businesses would like them to.

It’s the best explanation we have to justify continued weakness in the sector, as the investor base migrates (not altogether smoothly) away from the yield-seeking to the growth-oriented buyer.

We are invested in EPD


Downside Risks for MLPs

The Shale Revolution is a powerful recent example of why America’s system of capitalism is so enduring. We’re not just leaders in shale oil and gas, the U.S. is pretty much the only game in town (see America Is Great!). One day it will probably be the basis for college courses across the country to illustrate the power of the free market. A year ago OPEC abandoned its efforts to bankrupt the U.S. shale industry through ruinously low crude oil prices (see OPEC Blinks). Although it wasn’t well recognized in many other parts of the world, our domestic energy industry was able to harness a long list of advantages:

1) The right geology

2) Existing network of energy infrastructure

3) A highly skilled labor force

4) An entrepreneurial culture

5) Water supplies in the right places

6) Technological excellence

7) Constant drive for productivity improvements

8) Privately owned mineral rights

9) Highly developed capital markets

It’s not the first time the U.S. has used its economic advantages to win a battle. As a result, we are on a path to greater energy security, improved geopolitical flexibility and American Energy Independence.

It’s a great story and recounting it to clients is never boring. But where can it go wrong?

Clients often ask, and it’s a fair question, not least because few investors have forgotten the 58.2% drop in the Alerian Index from August 2014-February 2016. The recent distribution cut at Plains All American (PAA) (see MLP Investors Learn About Logistics) remind that the occasional negative surprise remains possible across a landscape of generally rising cashflows and declining leverage.

The most obvious threat is a recession. Energy infrastructure is about moving, processing and storing volumes of hydrocarbons. If economic activity slows, energy consumption of all kinds slows too. Although many pipeline contracts are underwritten by volume commitments from shippers, overall cashflows for the sector would still suffer from less throughput. During the 2008 Financial Crisis MLPs fell along with everything.

Lower crude prices are an ever-present threat, very real after 2015. Oil affects investor sentiment far more than cashflows, as we often note. However, the industry is also much more invested in the growth of domestic hydrocarbon output than it was ten years ago. The sensitivity of domestic production to pricing broadly affects the utilization of existing and newly built capacity. Energy infrastructure is mostly about volumes, but those volumes are increasingly sensitive to prices. As the U.S. increases its role in export markets, domestic output will be impacted by global prices.

Slower growth and weaker hydrocarbon prices are the obvious threats. Geopolitical risks rarely receive consideration until they’re presenting an imminent threat, but we think about those too.

The Middle East remains an unstable place. The nuclear agreement with Iran is at some risk of being abrogated by the U.S., with unpredictable regional consequences. Substantial crude oil passes through the narrow Straits of Hormuz, between Iran and the United Arab Emirates. The recent vote by Iraqi Kurds for independence risks creating a backlash not just from Iraq’s central government but also from Turkey with its sizeable Kurdish population. Recently, Turkey suspended deliveries of oil from Iraqi Kurdistan passing through a pipeline on its territory.

A disruption of crude oil from the Middle East would drive up prices, and might even stimulate increased U.S. production if sustained. In any event, domestic output would be unlikely to fall.

North Korea represent another potential hotspot, with the very real possibility of the U.S. being involved in armed conflict. While we won’t make any investment forecasts based on a scenario of war on the Korean peninsula, we do note that the physical assets of energy infrastructure businesses are virtually 100% located in North America dispersed across the country. There’s minimal non-U.S. exposure, although swings in commodity prices could still impact significantly.

When considering what can go wrong outside America, investments in Energy Independence would seem to offer more protection than other sectors.

The tax reform proposals lack sufficient clarity to assess their impact. However, a lower U.S. corporate tax rate should boost after-tax profits at most corporations, In addition, allowing investors in pass-through vehicles (which should include MLPs) to pay tax on their passive earnings at the lower, corporate rate rather than at ordinary income tax rates should further boost their attractiveness (see MLPs and Tax Reform).

Former Defense Secretary Donald Rumsfeld’s famous “unknown unknowns” are what planners in many fields worry about. What we’ve highlighted above includes certain known “tail-risk” events (i.e. unlikely but impactful). We consider these regularly, and new ones as they appear on the horizon. Part of defense includes owning solid businesses and avoiding leverage, which is how we invest.


A Futurist's Vision of Energy

Recently a client drew our attention to a presentation by Stanford University Futurist Tony Seba. He has made a splash with his predictions of imminent, dramatic changes in the transportation industry. In less than a generation he expects a world of self-driving (i.e. autonomous), electric vehicles (EVs) supported by a heavily solar/wind-powered electric grid. In June he gave this presentation which you might find interesting.

Tony Seba is an engaging presenter. Moreover, the future of U.S. energy infrastructure will be impacted both by the increasing use of renewables for electricity generation as well as the growth in EVs (renewables and EVs are separate topics, albeit linked). In discussions with investors both of these topics regularly come up. There’s the near-term impact on the sector of growing production driven by the Shale Revolution. Farther out, the growth in renewables (mainly solar and wind) combined with dramatic improvements in battery technology, could represent an existential threat to segments of the U.S. oil industry.

We read and think about these issues a lot. Behavioral economists teach that humans tend to make overconfident forecasts, whether it’s of equity returns, jellybeans in a jar, or the impact of new technology. Precise forecasts exude confidence and draw attention. A date when EVs will predominate is more eye-catching than a range of dates within which such change is more likely than not. Nonetheless, precision in such matters is usually wrong, and we are not with Tony Seba at the extreme end of predictions; the future is rarely so certain. He makes some specific forecasts, including that crude oil demand will peak in 2020-21, after which it will fall 30% by 2030. He also forecasts that by 2030, 100% of new mass-market vehicles bought in the U.S. will be autonomous EVs.

Exxon Mobil (XOM) recently published Outlook for Energy: Journey to 2040, their regularly updated long-term energy forecast. They have an institutional bias towards fossil fuels so they’re never going to line up with a futurist. Nonetheless, forecasting energy use is critical to their long term survival. Seba includes a reference to Eastman Kodak, a company which invented digital photography and was then destroyed by it. XOM will be aware of that example of disruptive technology.

The Outlook for Energy makes forecasts too, beginning with growth in global GDP and population. They forecast 1.8 billion cars, trucks and SUVs on the roads in 2040 (versus 1 billion today) as rising living standards in developing countries drive demand. While expecting impressive percentage growth rates in wind and solar, they expect oil and natural gas to increase their share of the world’s energy needs. Overall, they see fossil fuels slipping modestly, from above 80% to just under 80%, with both coal and oil losing market share to natural gas. They expect crude oil consumption to be around 17% higher in 2040 than it is today. By 2040 they expect 15% of new car sales globally to be hybrids, and 10% of U.S. car sales to be EVs.

To summarize:

  Seba XOM
Electric Vehicles 100% of U.S. sales by 2030 10% of U.S. sales by 2040
Crude Oil Consumption Down to approx 70MM Barrels per day by 2030 Up to approx 115 MM Barrels per day by 2040


One of these will be spectacularly wrong.

Although they’re both point forecasts and so unlikely to be precisely right, we think it’s more likely Seba will miss by a lot. His presentation opens with an old photo of New York’s Fifth Avenue in 1900 full of horse-drawn vehicles, and moves to 1912, same place, with all automobiles. It’s true that some new technologies have been highly disruptive, but it doesn’t follow that they all are. Seba’s analogy to the car is intended to validate his EV/solar forecast, although he wasn’t around in 1900 to predict the former.

Growth rates can quickly lead to exponential change when projected out a decade or more. Yet change more often follows an “S” curve, with a high growth rate during widespread adoption followed by slower growth thereafter. We think it’s unlikely the electric grid could adapt so quickly to transmitting the substantially increased electricity required to run a national EV fleet. We also note Seba’s assuming no new advances in the technology of the internal combustion engine, whereas there are continual improvements here too. And the Shale Revolution itself is a form of disruptive technology. We think natural gas is the most likely winner, as it’s the cleanest fossil fuel and enables increased use of renewables by providing baseload electricity for when it’s not sunny or windy.

The price advantage Seba forecasts for solar assumes that the recent substantial productivity improvements in shale drilling don’t continue at all. In fact, he assumes that all the losers, which includes automakers, utilities, oil and gas producing companies, refineries and all those invested in life today as we know it, will stand by passively while their business models are disrupted by new technology. In fact, they are and will continue to respond, by improving their own technology. Furthermore, until battery storage technology and cost improve substantially, we still need backup power for intermediate solar power.  This provides demand for of fossil fuel baseload capacity, which often comes from natural gas “peaker” plants (i.e that run only during times of high demand). It’s hard to see a widespread transition to renewables without increased natural gas usage..

An 80% drop in car ownership by 2030 (another Seba forecast) implies widespread car-sharing. Using an Uber-type app to summon an autonomous EV when you need it suggests acceptance of a generic car. What if you need a babyseat? Extra room for luggage? A big family? We think car demand will remain more heterogenous than Seba suggests. Other non-technology hurdles include issues of liability — if your autonomous EV causes an accident, who’s at fault? What if a software bug causes multiple, simultaneous collisions? The deep-pocketed corporations developing the technology will need protection from class action lawyers before it is allowed to go mainstream.

Directionally, Seba’s probably right in that we’re eventually moving to EVs. But investing requires timing too. Seba’s most extreme, widely known forecasts could miss and yet still gain plaudits for getting the direction right, in the same way an equity analyst might gain followers with the highest target price for a hot stock even if it never gets there. But as investors, we care about pace of change as well as direction. Vaclav Smil, a thoughtful and prolific writer about many topics including energy, articulated the major impediments confronting widespread, rapid adoption of renewables. This brief essay, albeit nearly four years old, is still relevant.

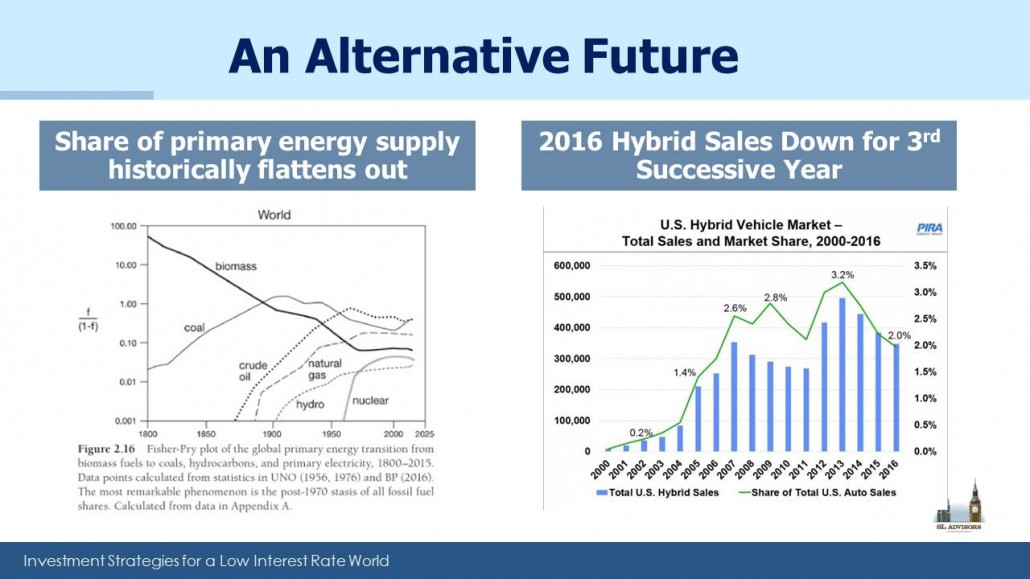
The left chart in the panel below looks complicated, but it shows the proportion of primary energy delivered by each source going back two centuries, on a semi-log scale. The point is that growth slows sooner than expected, and the notes underneath highlight that fossil fuels in aggregate stopped gaining market share in the 1970s, which is probably not intuitive to most people. The chart is from Energy Transitions: Global and National Perspectives, 2nd edition (2016) by Vaclav Smil. The chart on the right shows sales of hybrids and the sensational early growth that fizzled out. Had Tony Seba been giving his presentation in 2005, he probably would have had a chart projecting a car market dominated by hybrids and leaping from its then current 1.4% market share, whereas a decade later it was at 2.0%.

.avia-image-container.av-33n57n-5d902b2977efa9eb8f227211fb62db45 img.avia_image{ box-shadow:none; } .avia-image-container.av-33n57n-5d902b2977efa9eb8f227211fb62db45 .av-image-caption-overlay-center{ color:#ffffff; }

And yet, it really is an exciting future. Personally I can’t wait for autonomous vehicles. I’m sure I’ll own one myself once the technology is proven (I am known by my friends as a late adopter of new things). Being driven by software so the passenger can read, send a text message or even sleep will surely be a great improvement in safety. When I’m finally in my autonomous EV and not driving I’m sure it’ll be better for those around me. Although  Seba doesn’t highlight this, one of the strongest arguments in favor of autonomous vehicles is that the software will operate them more safely than unpredictable, sometimes impaired humans. Automobiles kill nearly 1.3 million people globally every year and an additional 20-50 million people are injured or disabled. In this arena like so many others, technology will eventually make the world a better place.

We watch these and other developments carefully. We acknowledge the danger of holding any view with excessive confidence, and new information can cause a reassessment.  The further out one goes the harder it is to be certain about oil demand and its price. Growth in wind, solar and other future energy technologies should be taken seriously and must already be a consideration for any big, conventional oil and gas project with a projected return over decades. The optimistic case for renewables highlights the incredible advantage of the Shale Revolution, where development costs are low, production quick, and investments recouped in months. This compares favorably with conventional projects (respectively, high, slow and over many years).  For now, we believe Tony Seba’s vision is farther off than he thinks, but what a fascinating journey we will be taking with American innovation revolutionizing the global energy markets from both sides.


Energy Sector Gathers Momentum

Last week I was chatting with an investor about the attractive valuations in the MLP sector. 2Q17 earnings were generally in-line, with the notable exception of Plains All American (see MLPs Learn About Logistics). Valuations are compelling, with the yield on the Alerian Index currently sitting at 5.5% above the ten year U.S. treasury, 2% above its 20-year average. On an Enterprise Value to EBITDA basis, energy infrastructure compares favorably with Utilities (see The Changing MLP Investor).

And yet, even though MLPs and crude oil have generally been moving together this year (see Crude and MLPs March Higher Together), in recent weeks MLPs have lagged the bounce in oil. So the natural question is, what is the catalyst that will cause investors to act on these valuation advantages?

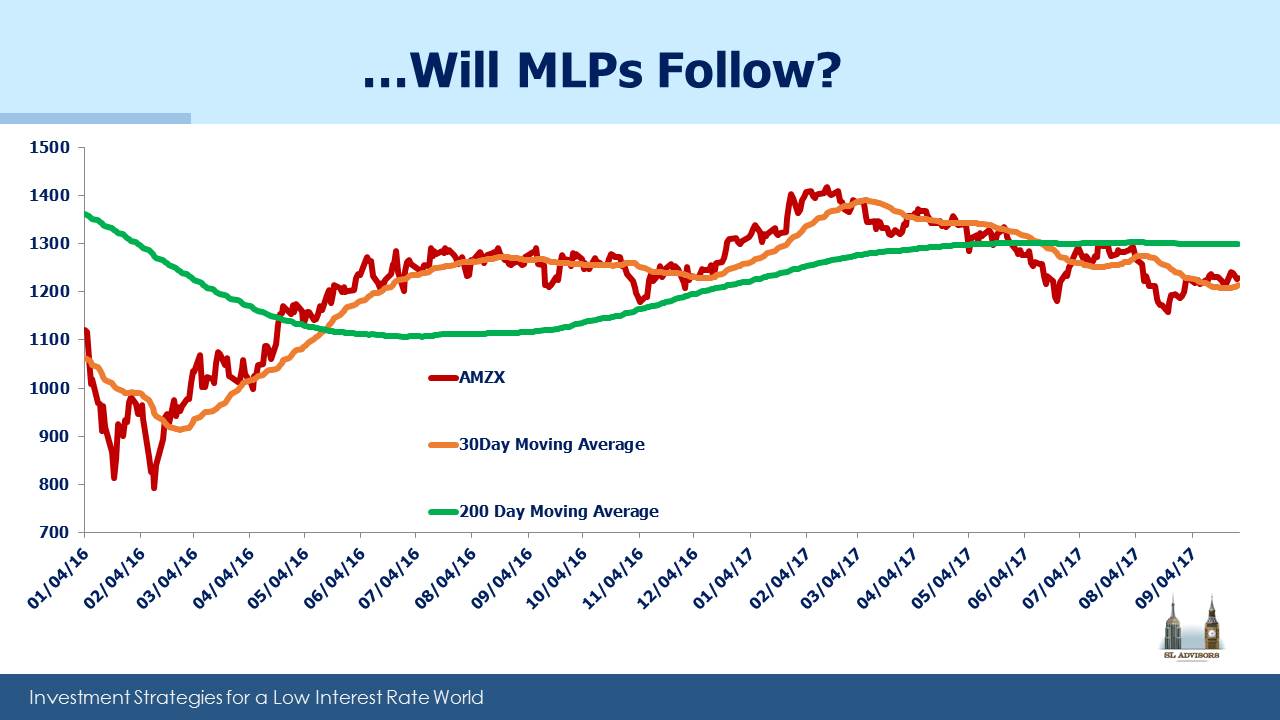
CFA charterholders have to pass three fairly rigorous exams that (among other things) demonstrate an ability to analyze financial statements. In an effort to include most forms of equity analysis there is a brief section on Technical Analysis. When I studied that material I could almost feel the apologetic tone from CFA Institute as they reconciled undoubted antipathy towards an area that has wide adherence and works just often enough to warrant inclusion.

.avia-image-container.av-4mv3jp-937e0bac27080f27de45d3146ba76095 img.avia_image{ box-shadow:none; } .avia-image-container.av-4mv3jp-937e0bac27080f27de45d3146ba76095 .av-image-caption-overlay-center{ color:#ffffff; }

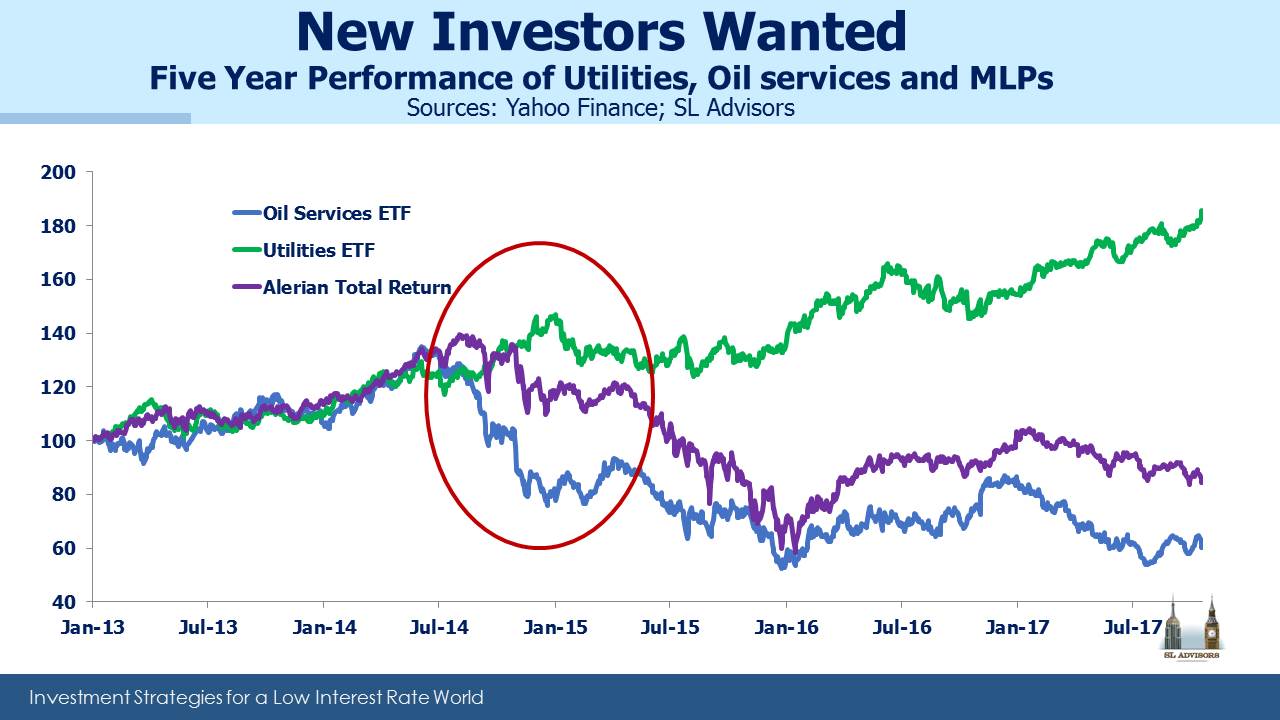
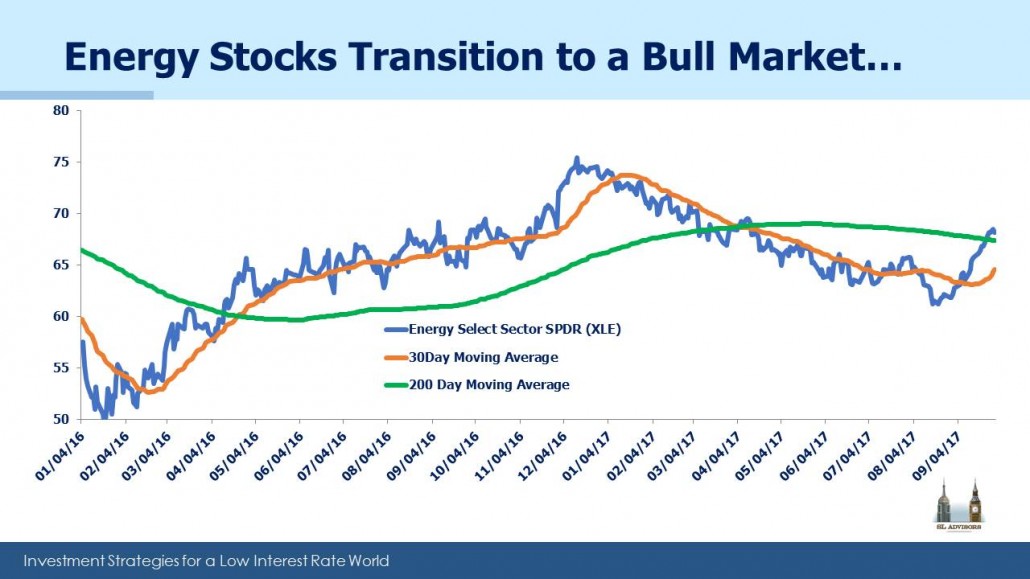
Many investors we know rely on fundamental analysis to make decisions but then use technical analysis to refine timing. The merits of an investment change far less often than its price, and technicals can help here. We’ve noted a pick-up in activity from some buyers partly because such analysis is indicating a change in trend.

It’s not just crude oil that has developed a recent uptrend. The broader energy sector has also moved sharply higher, with prices now above the 200-day moving average. In 2015 a tough operating environment for exploration and production companies (i.e. the clients of MLPs) led to substantial weakness in the energy infrastructure sector. Although they are clearly not synchronized, recent strength in crude and energy stocks would seem likely to improve sentiment among MLP investors. Performance between the two sectors is unlikely to diverge for long.

.avia-image-container.av-22f4g5-9b1ac01d1aedd83dc7f3307a98d923b0 img.avia_image{ box-shadow:none; } .avia-image-container.av-22f4g5-9b1ac01d1aedd83dc7f3307a98d923b0 .av-image-caption-overlay-center{ color:#ffffff; }

On a different topic, Alerian announced last week that they’d be capping individual constituents at 10% in the Alerian MLP Index (AMZ). This is a sensible move that brings this index into line with the Alerian MLP Infrastructure Index (AMZI). Enterprise Products Partners (EPD) was most impacted because it was previously 20% and was the cause for the change.

EPD’s share has risen in part because their market cap has risen relative to their peers but also because some MLPs have simplified their structure and been dropped from the index. The most recent example was Oneok (OKE), which merged its GP-owning C-corp OKE with its MLP, Oneok Partners (formerly OKS). Many people think of Kinder Morgan (KMI) as an MLP but following their simplification in 2014 which saw the assets of Kinder Morgan Partners absorbed into KMI, they have no longer been part of the AMZ (although still in AMZI). There’s more to energy infrastructure nowadays than MLPs, and C-corps represent an increasingly significant element.

Although Alerian does a good job in managing their indices, they have an odd way of measuring distribution growth. The 6% average annual growth rate they report reflects trailing growth of the current constituents, not the actual growth of the constituents that were in the index at the time. So the recent change in EPD’s weighting, which will similarly boost the weighting of several other names, will alter the historic growth rate. The actual growth rate experienced by investors in the Alerian Index of course won’t change. Running an index is complicated.

Finally, we’re heading into the fourth quarter, a time when seasonal patterns around MLPs become more important. In last year’s blog post on the topic (see Give Your Loved One an MLP This Holiday Season) we explained which months were best for buying purely when considering seasonal patterns. It’s worth rereading if you’re thinking of investing over the next few months.

We are invested in EPD, KMI and OKE


Crude and MLPs March Higher Together

For the first half of the year crude oil prices moved irregularly lower before bottoming in June, since when they’ve moved smartly higher. Master Limited Partnerships (MLPs) have roughly followed this path, and have also moved smartly higher in recent weeks. Non-crude cashflows drive MLP operating performance, but crude drives investor sentiment. No amount of typing by this blogger will shake the relationship between the prices of MLPs and crude.

Interestingly though, U.S. crude oil production has continued to grow all year, seemingly impervious to prices. From 8.85 Million Barrels a Day (MMB/D) in January, output reached 9.2 MMB/D in June. Hurricane season caused a slight late Summer dip in the Gulf of Mexico, but the Energy Information Administration (EIA) is forecasting an average of 9.3 MMB/D for the full year. Production is therefore forecast to continue rising into 2018, for which the EIA is forecasting 9.8 MMB/D. That would eclipse the prior record of 9.6 MMB/D set in 1970. America is Great!

.avia-image-container.av-4xsm6p-1ff3149566031adbd1ec1a416f589b15 img.avia_image{ box-shadow:none; } .avia-image-container.av-4xsm6p-1ff3149566031adbd1ec1a416f589b15 .av-image-caption-overlay-center{ color:#ffffff; }

Longer term oil forecasts from both the EIA and the International Energy Agency (IEA) are for rising prices. The EIA’s International Energy Outlook 2017 models crude oil roughly $25 higher by 2020. The IEA goes even further, warning of the risk of a price spike by 2020. They cite growth in annual demand of 1.6MMB/D (around 1.7%) as well as too little new investment in new sources of production. They note that spare capacity (mostly OPEC) of 2 MMB/D doesn’t even cover two years of growth in demand, and expect OPEC to eventually abandon their production limits.

As an aside, a friend recently told me about an investor he knows who is convinced oil prices will collapse as consumers flock to electric vehicles (EVs)  and shun the internal combustion engine. That is almost certainly not going to happen. In fact, depressed crude oil would be just about the worst thing for Tesla fans, because it would hurt their competitiveness. High oil prices combined with strong demand for EVs is a possibility; low oil prices and disinterest in EVs is another. Cheap gasoline will dampen the enthusiasm of those opting for environmentally-inspired transportation choices. Moreover, internal combustion engine technology improvements continue to reduce emissions, narrowing the gap with EVs.

The EIA expects overall energy use to grow worldwide even while energy intensity drops (meaning it’s used more efficiently for a given level of GDP). Other than coal, all sources of energy will see growing production with renewables growing the fastest. Non-OECD Asia is responsible for most of the forecast growth in energy consumption through 2040, including 80% of the growth in petroleum and other liquid fuels.

During the 2015 collapse in crude prices, U.S. production dipped but surprised many (including OPEC) at how robust it stayed. The drop in crude early this year didn’t seem to affect domestic output at all. We now seem to be moving into a period of rising prices combined with rising production. U.S. shale output just isn’t growing fast enough to satisfy the 1.6 MMB/D in new demand noted above as well as offset global depletion (estimated at 3-4 MMB/D annually; see Why Shale Upends Conventional Thinking). The world needs another 5-6 MMB/D in new supply, annually. Rising prices will stimulate shale drillers into more activity, but not enough to depress prices.

In presenting their latest forecast, IEA oil markets head Neil Atkinson conceded, “We underestimated the resilience of U.S. shale producers. We failed to understand the resilience. We failed to appreciate the technical ingenuity.” In other words, the IEA underestimated America. So did OPEC last year (see OPEC Blinks). Both the EIA and the IEA have had to recalibrate their models to reflect the ongoing success of U.S. shale (see Oil Forecasters Have to Work Harder).

Rising crude prices along with rising U.S. output could be just as potent for energy infrastructure stocks as the opposite combination was bad in 2015. Moreover, it’s not only crude output that is rising; the EIA is forecasting natural gas production to average 73.7 Billion Cubic Feet per Day (BCF/D) in 2017. This is up 1.4 BCF/D from 2016, and in 2018 a further jump of 4.4 BCF/D is expected.

Clearly, for the U.S. energy sector, its best days are still ahead.

Below is a new trademarked logo we have designed for our energy infrastructure business. We believe the Shale Revolution is leading to American Energy Independence, and our investment choices increasingly reflect the search for those businesses that will most clearly benefit. Expect to see more of this logo in the months ahead.

.avia-image-container.av-1x62v5-f033a7135b930eab2638efea138d2421 img.avia_image{ box-shadow:none; } .avia-image-container.av-1x62v5-f033a7135b930eab2638efea138d2421 .av-image-caption-overlay-center{ color:#ffffff; }


Litigating Away From a Cleaner Future

Earlier this month I visited a good friend and client in London where he invited me to address some Summer interns about what we do. In the first moments I was asked if I’d considered the moral aspects of enabling fossil fuel use. Recently armed by Alex Epstein (see The Moral Case for Fossil Fuels), I was able to parry by challenging them to define the metric by which energy use should be justified. Greater use of fossil fuels has led to enormous benefits for humanity (the only proper metric). Draconian cuts in fossil fuel use as advocated by some simply mean rationing energy. Developing nations use less energy than America and suffer shorter life expectancy as a result. Energy improves lives in countless ways.

When U.S. Secretary of State John Kerry advised Indonesians in 2014 to insist on clean energy while 31 million of them can’t access clean water, he was not occupying the high moral ground. Hygiene requires energy. Debating such issues with young college students is wonderfully stimulating; this group was smart and quickly willing to consider views that they initially perceived as unconventional. It’s impossible to leave such exchanges with anything other than a very positive outlook for the future.

Every rational person cares about the environment. However, sometimes those who describe themselves as “Environmentalists” hold an absolutist view that in its extreme formulation works against the very goals they strive for.

When the Federal Energy Regulatory Commission (FERC) approves a pipeline, they are usually required by Federal law to prepare an Environmental Impact Statement (EIS). This examines the impact on the surrounding area of building the pipeline, and assesses whether it’s in the public interest to proceed. Although the Sierra Club pursues many admirable goals, a recent legal challenge to a FERC-issued EIS reflects the practical challenges of being a purist.

Last month, the Sierra Club successfully argued in the U.S. Court of Appeals (DC Circuit) that an EIS should include the impact of burning the natural gas moving through a pipeline. Currently, FERC only considers the direct impact of pipeline construction. The Court found that the emissions from burning the natural gas delivered by the pipeline also needed to be considered in the EIS. The project in question is the Southeast Market Pipelines Project (SMPP) and it is already in operation transporting natural gas to Florida from points west. It’s possible the SMPP network may at some point be forced to suspend operations, although for now the legal battle continues and may even reach the Supreme Court. But the results won’t necessarily meet the Sierra Club’s goals.

Put aside the chilling impact on future infrastructure investment of a project approved by the regulator that might yet be hampered by legal challenges, even following completion. The Sierra Club, by opposing ALL fossil fuels (as well as nuclear power), makes their goal of a fully solar/wind energy sector Utopian, even farther out of reach.

Recent history shows that natural gas has helped the U.S. achieve cleaner electricity production than Germany, a proud champion of renewable energy. As we wrote earlier this year (see It’s Not Easy Being Green), because it’s not always sunny and windy, solar and wind rely on conventional sources of power to provide baseload supply. There’s still no commercial technology to store electricity from sunny days for use at night. In the U.S. that baseload is increasingly from natural gas, which is replacing coal over which it enjoys substantial emission advantages; not just less CO2 but no Sulfur, Mercury or other nasty particulates.  What Germany is finding is that because their baseload reflects a higher mix of coal, the positive effects of sunny, windy days are being offset.

.avia-image-container.av-2hvbjp-c4e984f78ce6dac863c7b9588241afd6 img.avia_image{ box-shadow:none; } .avia-image-container.av-2hvbjp-c4e984f78ce6dac863c7b9588241afd6 .av-image-caption-overlay-center{ color:#ffffff; }

Although it’s known as the Sunshine State, today Florida uses very little solar. Only 2.4% of its electricity comes from renewables (mostly biomass). However, that is changing and Florida Power and Light (FPL) is adding 2,100 MW of new solar capacity by 2023. Duke Energy Florida plans to add 700 MW by 2021. In June, Florida’s power plants produced 21,611 GWH of electricity. The 2,800MW of solar capacity additions noted could, if run at 100% of capacity 24X7, represent 10% of Florida’s electricity.

But they won’t, because even Florida is not permanently sunny. Solar’s intermittency means lower utilization than gas or coal plants and creates a symbiotic relationship with other, reliable sources of power. The Shale Revolution has unlocked enormous reserves of natural gas, and its abundance has led directly to a preference by utilities to switch away from coal. Across America, power stations have been exploiting this huge advantage to achieve significant improvements in emissions. This success is all the more remarkable when you consider that the Federal government is ambivalent at best about adopting formal goals to reduce emissions.

There’s a certain intellectual incoherence in opposing a source of energy that enables wider use of renewables and is already driving emissions down. FPL needs reliable power in order to use solar.  Coal doesn’t travel through pipelines and can be moved by truck or rail without requiring a FERC EIS that is subject to a legal challenge. Coal still provides 15% of Florida’s electricity. An unintended consequence of the Sierra Club’s well-intentioned single-mindedness may be a longer reliance on coal than would be otherwise necessary.