AMLP Is Running Out Of Names
Next month VettaFi, which owns the Alerian indices, will announce a rebalancing of the Alerian MLP Infrastructure Index (AMZI). This will impact the Alerian MLP ETF (AMLP) which tracks AMZI. For an index fund it does a poor job of keeping up with its index – ALPS Advisors, who runs it, reports alpha of –3.03% over the past three years. That’s mostly due to the two tax restatements they made (see AMLP Has Yet More Tax Problems). Over the past year AMLP’s NAV has been adjusted down by 6%. ALPS wisely warns that, “…the daily estimate of the Fund’s deferred tax liability used to calculate the Fund’s NAV could vary significantly from the Fund’s actual tax liability.” It’s currently $329MM, around 4.3% of NAV.
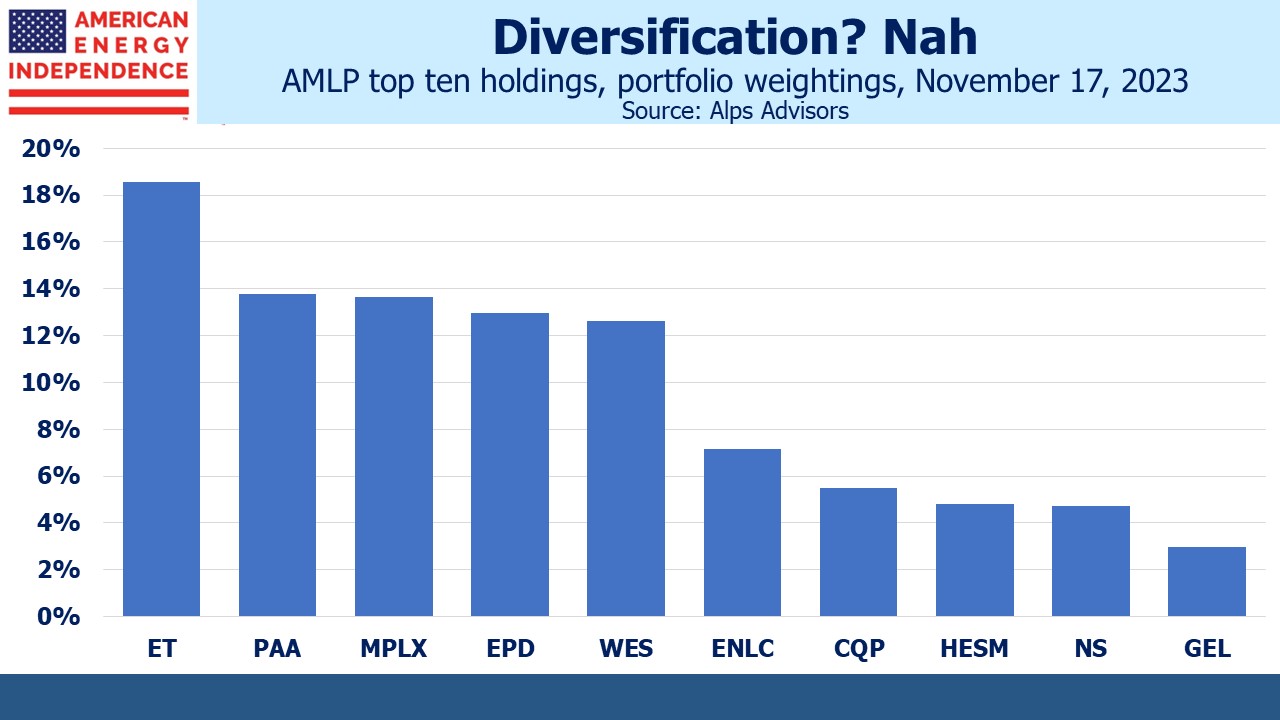
AMLP’s fiscal year-end is November 30th, so investors will be hoping for no further tax revisions like the one that was released that time last year. December 15th is the next hurdle, because that’s when VettaFi will rebalance AMZI. It could use it. Currently, the top five names are 72% of the portfolio. Energy Transfer (ET) is over 18%. Just ten names constitute 97% of the portfolio.
AMLP is for those who like their market exposure concentrated.
Morgan Stanley recently pointed out that ET’s weight is more than 6% over the normal 12% cap. It’s not an easy problem to solve. The number of MLPs is declining – ET’s recent acquisition of Crestwood removed another one. Being an MLP-dedicated fund means to love an ever-decreasing number of names.
ET has performed well this year, with a YTD total return of 25%. ALPS didn’t decide to overweight the name, it’s a consequence of their index construction. Morgan Stanley points out that if VettaFi decides to bring ET back to 12% in their December rebalancing, that could put downward pressure on the stock.
AMLP’s distributions are also now classified as 100% income. This is a change from prior years when they were almost always a return of capital, passing through the tax deferred benefit of MLPs to AMLP holders. Evidently the tax review that led to the cumulative 6% NAV adjustment also reclassified the tax nature of their distributions. It’s unlikely many AMLP investors are aware of this, but those holding it in taxable accounts will receive another unpleasant surprise when they file their 2023 tax returns.
There is so much wrong with this fund.
It is a great example of investor inertia. At $7.5BN in AUM, financial advisors who still use AMLP draw false comfort from knowing that legions of their peers are passively accepting a pool of fewer names and uncertain tax treatment. Investment performance and portfolio construction would render this fund unable to pass the most cursory due diligence of any investment firm’s review process. Its longevity and size substitute for careful analysis.
If your financial advisor still has you in AMLP, your portfolio isn’t receiving the attention it deserves. Ask why not.
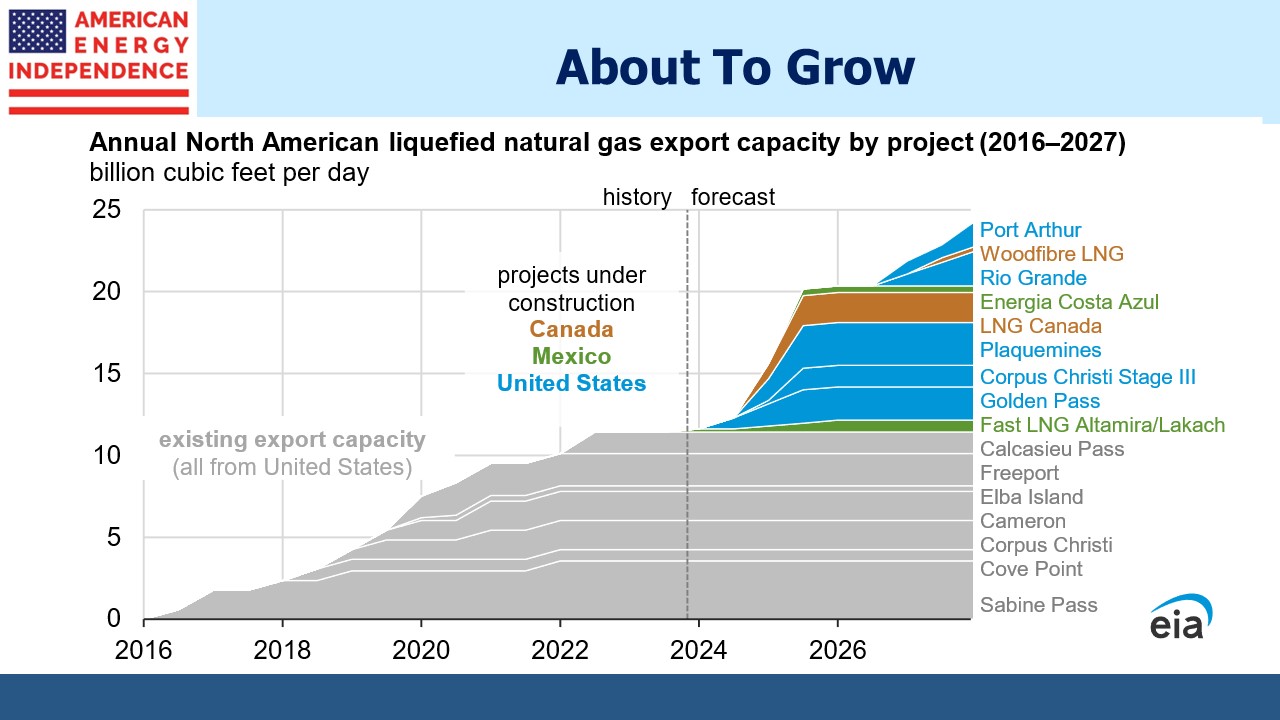
Fundamentals for midstream energy infrastructure continue to be supportive. 3Q23 earnings were generally good. The US Energy Information Administration recently noted that North American LNG export capacity is on track to at least double over the next four years, from 11.4 Billion Cubic Feet per Day (BCF/D) currently to 24.3 BCF/D. As well as five additions in the US, Mexico is adding three and Canada two.
US natural gas is among the world’s cheapest. The constraint on selling more is the capacity of the liquefaction plants currently in operation. Ramping up is a slow process, but as the chart illustrates export growth is coming. US natural gas will contribute to reduced global emissions by allowing more LNG buyers to rely less on coal.
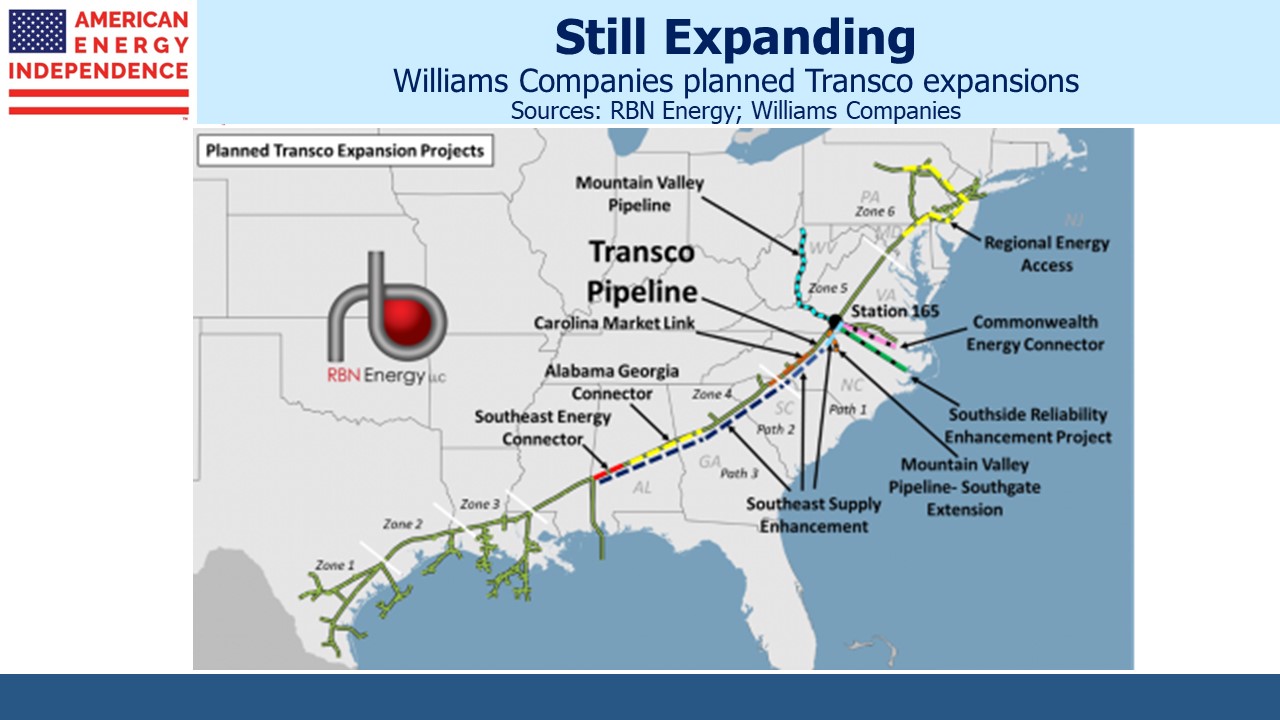
Earlier in November Williams Companies (WMB) confirmed they’d be moving forward with their Southeast Supply Enhancement project which will increase natural gas takeaway capacity out of the Marcellus shale via their Transco pipeline network. This will increase the volume of natural gas able to go south, potentially supplying our growing LNG export capacity along the gulf coast.
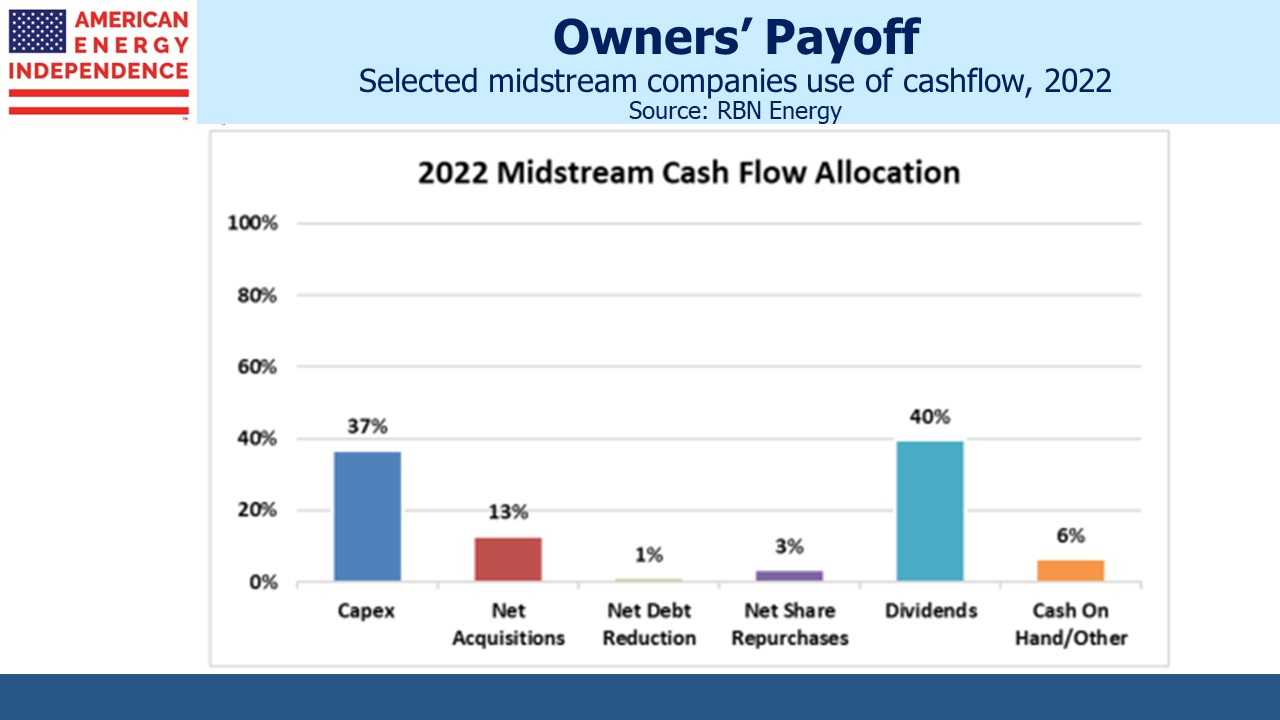
RBN Energy, a research firm that provides many useful insights, noted the trend towards more investor-friendly allocation of cash flow. Last year the 13 biggest midstream companies (seven c-corps and six MLPs) returned 43% of cashflow to investors via dividends and buybacks. Add in retained cash of 6%, and this equaled the 50% share spent on capex and acquisitions.
In 2019 dividends were 48% of cashflow (there were no buybacks). Capex plus acquisitions was 83%. The difference was financed with increased debt (34% of cashflow).
Energy is a cyclical business, but the increasing dedication of cashflow to investor returns is becoming a welcome habit.
We have three have funds that seek to profit from this environment:


