The Outlook for Energy

Exxon Mobil publishes a long term energy outlook (The Outlook for Energy: A View to 2040) which they update annually. It’s full of interesting facts and charts on energy use and is well worth reading. Integrated energy companies like Exxon Mobil commit capital to projects whose payoff can take decades, and so they are inevitably in the long term forecasting business. The Outlook for Energy provides a perspective on their thinking as well as an interesting snapshot of likely shifts in energy consumption.

Globally, the number of middle-class households (defined as having discretionary income to spend beyond basic necessities) is the most important input into the demand side. Although demographers forecast global population to rise by 2 billion to 9 billion by 2040, more significant for energy demand will be the more than doubling of members of middle class households in just fifteen years, from 1.9 billion to 4.7 billion by 2030 (according to the Brookings Institution). In spite of this, The Outlook for Energy anticipates substantially slower rate of actual energy demand as energy intensity (the amount of energy required to produce a fixed amount of GDP) improves in the developing world to reach present day levels in the U.S.

Half of the increase in energy demand from Transportation will occur in China and India, as a result of which heavy-duty use (trucks) will substantially outpace light-duty (mainly private automobiles). In spite of an expected near doubling in the number of cars of the roads, substantial improvements in energy efficiency will result in little overall change in energy demand from this sector.

As a result of increased efforts to control pollution, CO2 emissions are expected to eventually flatten out and then begin declining over the next 10-15 years. Given the uneven nature of such initiatives globally, this must be one of the more speculative forecasts.

The most significant change in long term supply in recent years is most assuredly the development of “tight”, unconventional oil and natural gas liquids (NGLs) in North America. In just a few years unconventional gas production in North America is likely to exceed the total from the Middle East, turning the U.S. into a significant net exporter within ten years. Although coal will continue to be a substantial source of electricity supply through coal-burning power stations, it has been falling as a percentage of fossil fuels used for many years. In fact, recently Beijing announced it would be closing its last coal-fired power plant by the end of 2016.

Overall, The Outlook for Energy provides a useful global, long term perspective and highlights America’s place evolving role as a producer.


Activist Update

Activist hedge funds can be a positive force. Although this isn’t always true (Keith Meister of Convergex so abused ADT investors that his actions caused us to apply the “Corvex Discount” to other stocks in his viewfinder), it’s probably more often than not beneficial to existing investors when a hedge fund shows up.

The most recent case involves Tetra Technologies (TTI), about which we wrote a few weeks ago as an example of the power of the MLP General Partner. Dimitri Balyasny just filed a 13G (indicating a passive stake) in TTI and a 5.3% investment. Acquiring 4.3 million shares of TTI is quite a trick, considering their average daily volume of under 1 million shares.

Other activist-owned stocks of interest to us that were recently in the news include Dow Chemical (DOW), which last week announced the sale of its chlorine business (DOW shareholders will own 50.5% of the resulting chlorine business with Olin Corp). Hedge fund Third Point has been a long-time advocate for value-enhancing moves. Another is Hertz (HTZ), which is owned by a virtual who’s who of hedge funds including funds run by Carl Icahn, Larry Robbins, Jeffrey Tannenbaum and Barry Rosenstein. HTZ has been recovering from some self inflicted wounds including accounting mistakes, poor pricing strategy and the relocation of its headquarters to Naples, Florida so as to be close to the (now former) CEO’s golf club. The persistent lethargy in HTZ’s stock price shows that it takes more than four activist investors to raise the price. However, moves in recent months to hire new management are positive signs. Today Morgan Stanley lifted its sell recommendation.

We are invested in TTI, DOW and HTZ.


Follow the MLP Money

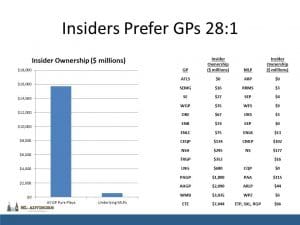
We’ve long advocated investing in the General Partners (GPs) of Master Limited Partnerships (MLPs) rather than the MLPs themselves. Most importantly, the GPs have preferential economics in the form of Incentive Distribution Rights (IDRs) which entitle them to up to 50% of the Distributable Cash Flow (DCF) the underlying MLP generInsiders Prefer GPs Original Chart Largerates. This entitlement is immune to additional issuance of equity, so GPs in effect maintain their economic stake even while the MLP grows its asset base funded with new issuance of equity and debt. In this way, MLP GPs are like hedge fund managers, in that asset growth always benefits them economically. MLP LP unitholders are similar to hedge fund investors in that asset growth may benefit them depending on the return on those additional assets.

MLP sponsors have long recognized  the benefits of the GP. It’s most powerfully illustrated in the chart at left (source: SL Advisors) showing insider ownership of GPs versus the underlying MLP. By a factor of 28:1 the money invested by the people who run MLPs favors GPs over the underlying MLPs. Not every MLP has a GP. Some have bought their GP back, creating a single class of equity. But where an MLP has a GP, if you invest in it you’ll most likely be aligning your interests with the insiders. By a factor of 28:1.


Unusual MLP Debt/Equity Issuance

Master Limited Partnerships (MLPs) performed poorly last week, with the Alerian Index dropping 4.3%, bringing it to -7.7% YTD.  The yield on the index is now around 6.4%, 4.3% above the ten year treasury which is historically an attractive level. There were a couple of unusual financing transactions undertaken by MLPs over the past week. One was the issuance by Kinder Morgan (KMI) of Euro-denominated debt. They issued €1.25BN divided between seven and twelve year maturities. KMI has no natural need for Euros since their business is all in North America, and because they don’t operate there one might think that European investors wouldn’t be that familiar with them as an issuer. Nonetheless, KMI was able to issue seven year debt at 1.50% and 12 years at 2.25%. These yields are lower than what they’d pay in the U.S., and while it’s tempting to suggest that the declining € was an additionally attractive feature (since if the € is weaker against the $ when the debt matures that will create a further gain for KMI), such transactions typically involve a currency hedge, since KMI’s business is about running pipelines not speculating on FX rates.

But even with the hedge, it likely represents attractive financing for KMI and reflects a positive view of their investment grade debt outside the U.S.

Another unusual piece of financing came from Targa Resources Corp, (TRGP). TRGP controls Targa Resources Partners LP (NGLS), and while equity is normally issued at the MLP level, in this case the C-corp which owns the General Partner (GP) and Incentive Distribution Rights (IDRs) for NGLS carried out a secondary. They raised $292 million which could increase to $336 million if the underwriters exercise their 30 day option to buy additional shares. In effect it increased the stock component of TRGP’s earlier purchase of Atlas Pipeline Partners and Atlas Energy which closed at the end of February. Pure-play GPs need never issue equity because they don’t have any assets to finance. However, TRGP is a C-corp that owns and controls physical assets in addition to NGLS’s IDRs. As a result of the additional equity, TRGP’s Debt/EBITDA will come down to a pretty conservative 2.9X since they’ll use the proceeds to pay down part of the revolver that helped finance the Atlas acquisition.

The other bit of news was that the IRS will once again begin issuing Private Letter Rulings (PLRs). A company contemplating dropping assets into an MLP structure can approach the IRS and request a specific ruling on whether the proposed transaction will qualify as an MLP. The IRS had stopped issuing these almost a year ago so it could review the law and come up with coherent regulations to guide its decisions. The resumption of MLP related PLRs will be welcomed by companies whose planned drop-down transactions had been on hold during this period of time. In our view the trend had previously been towards a somewhat more liberal interpretation of the types of assets eligible to be placed in an MLP structure. So far there’s been no indication from the IRS about the results of their 11 month internal deliberations, so we’ll find out as new transactions are made public.

We are invested in KMI and TRGP.


Two Examples Revealing the Power of the MLP General Partner

Tetra Technologies (TTI) is a small oil and gas services company. Small cap energy was perhaps the least pleasant place to be invested since last Summer, and TTI’s stock duly fell from $13 last Summer to $5 recently (it closed on Friday at $5.38). TTI owns 42% of Compressco LP (CCLP), an MLP that provides compression services all along the natural gas value chain from the wellhead to gathering and processing, storage and distribution. The value of TTI’s LP interest in CCLP is $230MM based on Friday’s market prices. However, TTI also owns the General Partner (GP) for CCLP. Although the GP Incentive Distribution Rights that TTI received was less than $1MM in 2014, CCLP’s growing cashflows will soon be lifting TTI’s split up towards the 50% maximum of CCLP’s Distributable Cash Flow (DCF). CCLP has a conservative 1.7X coverage on its distribution. But based on the outlook for its DCF growth, we think these IDRs could soon be generating $20MM annually for TTI. Applying a 30X multiple (a reasonable assessment for GP IDR cashflows) values just TTI’s GP interest in CCLP at around $575MM. That’s without including any value for the 42% of LP units that TTI already owns, or TTI’s other energy services businesses. TTI expects its LP interest in CCLP to generate $32MM in DCF in 2015. This is worth $400MM, or $5 a share at TTI’s multiple or at CCLP’s current price, which seems undervalued with an 11% yield and 1.7x coverage, $244M  (about $3 per share of TTI).

TTI’s current Enterprise Value (EV) is $834MM and its market cap is $432MM. GAAP accounting requires that TTI consolidate CCLP’s debt on its balance sheet although CCLP’s debt is not guaranteed by TTI. On this basis TTI’s EV is $1.3BN, and likely makes TTI’s balance sheet appear more leveraged than it will soon when the GP IDRs start generating more cash.

TTI has a legacy E&P business (Maritech) that has been a significant drag, but they should be finished with its remaining liabilities this year. The rest of TTI’s business should be able to generate around $80MM in free cash flow annually. We think we could be close to an inflection point in CCLP’s ability to generate increasing cashflows which will reveal the value in the IDR’s TTI owns as they move up to higher splits. We think TTI has substantial upside from current levels. Although TTI is not traditionally regarded as an MLP GP, much of its potential upside comes from that element of its valuation.

Another interesting transaction that took place earlier in the week concerned the acquisition by Western Gas (WES) of Anadarko’s (APC) 50% interest in the Delaware Basin JV gathering system. APC is WES’s sponsor. What’s unusual about this deal is WES doesn’t have to pay for the assets it’s acquiring until 2020. At that time, it will pay eight times average 2018-19 EBITDA less capex. WES will receive cash from its newly acquired assets immediately, and of course so will Western Gas Equity Partners (WGP), the GP of WES that is still 88% owned by APC. Paying for something in the future at a reasonable multiple based on its performance while enjoying cashflows immediately doesn’t happen every day, and in this case required the benevolent control of WES by APC. WGP benefitted without having to contribute any capital to the transaction, once again illustrating the power of the GP.

We are invested in TTI and WGP.


Why Boston Pays High Prices For Electricity

Natural gas prices vary widely — not just seasonally (electricity generation for summer air conditioning and winter heat create a familiar wave pattern to prices) but also regionally. It’s well known that natural gas prices are higher in many parts of the world than in the U.S. Probably less well knownn is the regional differences that occur within the 48 contiguous states.

The starkest contrast must be between North Dakota, where gas is flared because the infrastructure is not in place to move it, and New England where insufficient infrastructure exists to service peak periods. This night-time satellite image from NASA shows the many illuminated metropolitan areas, but the area denoted by the rectangular box is how the flaring of natural gas in the Baaken Shale in north Dakota (a very non-metropolitan area) appears. The excess methane is produced along with crude oil, and for now there is no place for it to go. The CO2 produced by flaring is the equivalent of 1 million new cars on the roads. Regulations are already being tightened; the amounts flared have fallen from 35% of methane produced in 2013 to 26%, and the goal is to reduce it further to 15% or lower by 2020.

Meanwhile, as everybody living in northern states knows, this has been another bitter winter. Boston had to suspend local regulations in order to dump snow into Boston harbor, since they had run out of places to put it. Less well known is that the price of natural gas in New England reached $19 per MBTU recently. This compares with spot prices of around $3 at the Henry Hub. The price in Willliston, ND, as shown by the flaring in the satellite photo, is zero.

New England’s energy infrastructure is widely acknowledged to be inadequate to the task. Some of the problems are self-inflicted, including a reluctance to invest in fossil fuel infrastructure in the hope of more “green” alternatives. Kinder Morgan’s (KMI) proposed pipeline from Pennsylvania has run into heavy local opposition, even though 45% of the region’s electricity is produced by burning natural gas. There’s also been a reluctance to make greater use of electricity produced across the border by Ontario Hydro.

New England suffers from other challenges of geography though. Situated on the coast, it is not on the way to anywhere which means any pipeline built is going to stop there. And the region suffers from extreme cold which causes spikes in energy usage, as we’ve seen recently.

This does highlight the ongoing need for new energy infrastructure though. Abundant supplies of natural gas are in North Dakota as shown, and (more relevant for Boston) also in Pennsylvania. It hasn’t been as easy as you might think for New Englanders to benefit from this reasonably accessible supply, but there are plans in place to resolve the bottleneck. Spectra Energy (SE) has an initiative called Access Northeast which is designed to supply more gas at affordable prices for electricity generation. The governors in the region have also been working together seeking an improved situation.

The point of this is that the global price of oil has very little to do with the need for improved peak supply of gas in Boston. Companies like KMI and SE are pressing ahead with these and many projects where traditional concerns such as regulatory approvals, easements, construction costs and financing are more important than the price of oil. For cold Bostonians paying temporarily high prices for electricity, such improvements can’t come fast enough. We are invested in KMI and SE.


MLP Buybacks

You rarely see MLPs buying back their stock, by contrast to companies in most other industries. Buybacks provide a tax efficient way to return excess capital if the stock is undervalued.  Because MLPs invest heavily in CapEx and generally distribute most of their free cashflow to LP unitholders there’s rarely any left over for buybacks. In fact, they regularly issue shares to raise capital to invest in projects.

Energy Transfer Equity (ETE) is an exception. In last week’s earnings call they announced a $2 billion buyback, to be executed opportunistically. This represents almost 6% of the market cap of the business, and is a tangible example of management’s stated view that ETE is under-priced. Meanwhile, ETE’s distribution is growing strongly, with a 30% year-on-year rise.

This doesn’t mean that ETE has any shortage of projects in which to invest.  ETE receives part of the incremental cash generated from the capital expenditures at it’s underlying MLPs.  In spite of the slowdown in North American shale development, ETE’s opportunities are such that they’re expecting to invest $7B in new projects at Energy Transfer Partners (ETP), $5B at Regency Energy Partners (RGP), and $2B at Sunoco Logistics (SXL) all of which will generate cash flows for ETE though its Incentive Distribution Rights.

In short, ETE  can invest in new projects though its MLPs using the cash flow received at the ETE level to pay distributions, make acquisitions, or buy back its own stock. The prospects in energy infrastructure clearly look good from where they’re sitting. We are invested in ETE.


The Hidden Tax Bite of MLP Funds

Master Limited Partnerships (MLPs) are inexorably linked with those annoying K-1s in the minds of many investors, complicating tax reporting. For some people it’s one of the few things they know about MLPs and the muttered warning of their accountants to avoid K-1s keeps them away from the asset class. Direct holdings of MLPs are the most efficient way to invest in the sector, and in my experience the K-1s aren’t that big a deal. MLPs fully understand the barrier tax reporting represent to many potential investors. As a result, almost all MLPs now provide K-1s electronically and they are issued well before the April tax filing deadline. I’ve also yet to identify an accountant who will put a price on the additional cost of including a K-1 in a client’s tax return. Even at $100 each and a dozen K-1s, it’s well worth it for a portfolio of $500K or up invested in MLPs.

Not everybody has that much to invest, and others may nonetheless still prefer a simpler tax return consisting fully of 1099s for their tax reporting. Ten years ago I seeded Alerian Capital Management’s hedge fund when I was at JPMorgan. Much time and many expensive hours of tax advice were spent trying to come up with a way of maintaining the tax deferral benefits available to direct investors in combination with the simpler tax reporting of a 1099. The bottom line is, there is no way to do it. In this respect, the tax code is watertight. You can hold MLPs with K-1s, or you can invest through a vehicle that provides 1099s at the cost of a substantially greater tax burden.

For many years the industry didn’t spend much energy on the less efficient, 1099 route. But in recent years that has changed, as it turns out there is a ready pool of buyers who will sacrifice quite a lot for tax simplicity. In fact, the solution is a pretty blunt instrument in tax terms. Holding MLPs in a corporation (a “40 Act Fund”, which is a mutual fund or exchange traded fund), solves the tax problem by simply paying 35% tax on the returns. You can have MLPs with K1s, or 65% of MLPs with 1099s. Many people choose the latter, to the evident amazement of people in the industry. An example is the Mainstay Cushing MLP Premier Fund (CSHAX and CSHZX). I remember Jerry Swank, Cushing’s CEO, at a conference some years ago commenting with incredulity at the interest in a competitor’s exchange traded fund (ETF) which solved the tax reporting problem with the 35% haircut. But consumers know what they want, and Cushing subsequently provided it to them.

I wonder how many really know what they’re buying? CSHAX sports a yield of 6.34%, slightly above the yield on the Alerian Index of 6%. It invests in MLPs. But looks can be deceptive; CSHAX has underperformed the Lipper Energy MLP Fund for each year of its existence. Its expense ratio for 2013 (the most recent year available) was a whopping 9-10% (depending on the share class). Most of this (around 8%) is the “Deferred Income Tax” expense, which is the 35% Federal corporate income tax bite that the fund pays in order to provide those 1099s. 2013 was a great year for MLPs so the tax drag is unlikely to be that high every year. But it will nonetheless be an ever-present penalty, eating up a portion of results year after year. Due to a quirk in the way yields are reported, the 6.34% yield advertised by CSHAX is essentially what the fund pays BEFORE adjusting its NAV down to reflect the tax liability. The net, after tax result to the investor is inevitably lower, and that’s before they pay their own taxes.

Like many things that retail investors buy, it’s disclosed but probably not understood. ’40 Act companies that maintain MLPs at less than 25% of their holdings qualify for pass-through treatment, which means the deferral characteristics carry through to the investor. It’s the best you can do in terms of holding MLPs and avoiding K-1s. We run a mutual fund that offers this structure.


More Useful Earnings and Guidance From the MLP Sector

Among energy infrastructure companies of note delivering earnings this past week was Spectra Energy (SE) and Spectra Energy Partners (SEP), the Master Limited Partnership (MLP) it controls. The results were good, coming in slightly ahead of estimates. More important was that their backlog of new projects remains robust. Last year SE management produced a soundbite “Drive to 35” forecast, meaning they intended to secure $35BN in new projects by 2020. In their Analyst Day (which came a day after earnings), they reported that almost half of this goal is already in hand. This is important because the bear case for MLPs and U.S. energy infrastructure is that future growth will be cut as E&P names respond to the oil collapse by reducing spending. So far that isn’t panning out among the individual names we follow that have reported recently. There have been modest reductions in planned capex, such as Kinder Morgan (KMI) reducing new investment related to its CO2 business, but the changes have been minor, <5% of planned expenditure.

SE currently pays a $0.37 quarterly dividend, generating a yield of just over 4%. Management is confident they can grow the dividend at $0.14 annually through 2020 over the next couple of years while maintaining coverage above 1X, which is growth of around 9%. Also notable was that the majority of the planned capital expenditure (capex) will take place at their MLP, SEP, where it will be funded. In other words, no new equity issuance for SE which owns the General Partner (GP) and Incentive Distribution Rights (IDRs) for SEP. Asset growth at SEP will increase cashflows to its controlling entity SE — just as asset growth at a hedge fund invariably benefits the hedge fund manager. SE does much more than simply collect cash from SEP, but dividend growth at SE is going to be substantially funded  by other people’s money coming in to SEP.

Plains All American Pipeline (PAA) and its publicly traded GP, Plains GP Holdings (PAGP), both reported earnings. PAA reduced its planned capex for 2015 by 9% compared with 2014 as they reassessed certain projects with today’s lower oil price. They also reduced the midpoint of their EBITDA guidance by 6% compared with figures provided in November. This in turn reduced forecast distribution growth at PAGP to a still robust 21%. Management is well regarded and market reaction to this seemed to conclude that they were being conservative. PAGP currently yields 3%, which while lower than many other energy infrastructure securities is still attractive in our opinion because of the very high growth rate. Their 4Q14 distribution was up 27% over the prior year.

In sum, these two businesses are adapting to lower oil prices but are largely continuing along a similar financial path to last year. We prefer the GPs because of their preferential economics and governance rights (just as hedge fund managers are better investments than hedge funds). Of the names mentioned, we are invested in SE, KMI and PAGP.


MLPs Report Encouraging Prospects

It’s earnings season, and last week Enterprise Products Partners (EPD) reported another solid quarter. An appealing feature of EPD is the absence of a General Partner (GP). So unlike many other MLPs, EPD LP unitholders do not suffer a haircut to Distributable Cash Flow (DCF) from GP Incentive Distribution Rights (IDRs) before the cash makes its way to the LPs for their distribution. This allows the growth of DCF from EPD’s portfolio of assets to flow right through to EPD unitholders, thereby giving it a lower cost of capital than would be the case if there was a GP. Insiders also own 35% of the units, a significant alignment of interests.

EPD’s full year results came in modestly better than expected and their distribution growth from 2013 was +5.8%. They also have unusually high DCF coverage of 1.4X which allows them to fund part of their planned growth through this excess of DCF over declared distributions. EPD is positioning itself to support the U.S. shift to role of refined products exporter, and its planned growth capex is on the same trajectory as it was last Summer when oil was above $100 bbl.

Kinder Morgan (KMI) held their Analyst Day on Wednesday and provided further detail on the business following their earnings release the prior week. As they pointed out numerous times during the day of presentations, 85% of their 2015 cashflows are fee-based and a further 9% are hedged, leaving only 6% subject to commodity price swings.

NuStar (NS) was also interesting, in that their reported earnings showed distribution coverage of 1.1, at last sufficient to cover payouts to unitholders. It’s not that long ago that  their distribution was at risk, but they have exited the asphalt business, greatly reduced their commodity sensitivity and focused on the storage business. Analysts on the earnings call were even asking about the timing of a distribution increase. NS has a publicly traded GP called NuStar GP Holdings (NSH). Its current distribution generates a yield of 5.8%, very high for a GP. NSH receives up to 23% of the DCF of NS and it is currently at that level. As the business returns to growth NSH’s IDRs, 13.1% LP interest and smaller outstanding number of unit compared with NS should translate into roughly twice the distribution growth rate as that experienced by the other LP unitholders in NS. It’s why we prefer the GPs.

We are invested in EPD, KMI and NSH.