Advice for the Fed

There must be more words written about the Federal Reserve and tightening of interest rates than any other issue that affects financial markets. A Google search throws up an imprecise “about 750,000” results! If each one is 250 words (less than your blogger’s typical post) that is 239 versions of the King James Version of the Bible. Although this most secular of topics is clearly not short of coverage, I’ll try and offer a different perspective.

An estimated 187 million words or so reflects the importance of a move in rates. Since the last rate hike was nine years ago, the Fed is spending much effort trying to make the eventual move anti-climactic. If their announcement is greeted with a financial yawn, that will represent a successful communication strategy. It’s not just that we’re out of practice in dealing with rising rates; it’s that the announcement and implementation both happen together. The Fed announces a hike in the Fed Funds rate, and implements it right away. The result is that we head into the day of an FOMC meeting with countless market participants and unfathomable amounts of borrowed money not knowing if their cost of borrowing overnight money will be instantly higher than it was yesterday. The uncertainty about how others will react to an immediate change in their cost of financing is why there is so much angst surrounding the “normalization” of monetary policy.

It occurred to me that the Fed could separate the two. Instead of offering various shades of certainty around when they will raise rates, why not say that any hike will take effect with a three month delay? Term money market rates would immediately adjust, but if the Fed announced a hike with effect at a certain future date the knowledge of higher financing would not coincide with the actual impact on financing over three months and less. Trading strategies that rely on a certain level of financing will have some time to adjust. Market participants will know for certain that rates will be higher in three months’ time, as opposed to having to make informed judgments based on public statements and economic data. And while the clear expectation will be that the pre-announced tightening will take place on schedule, the Fed does retain the flexibility to undo it in extraordinary circumstances.  It would take some of the guesswork out of getting the timing right.

It’s seems such a simple fix to the problem. I haven’t read all of the 750,000 Google results to see if they include this suggestion, but I’ve never seen it myself. Maybe someone at the Fed will read this. They may conclude it’s worth what they paid for it, like any free advice. We’ll see.


Listen to What The Oil Price Is Saying

The collapse in oil prices was the dominant story of 2014, and it’s shaping up to be the dominant story of 2015 too. In the popular narrative, development of unconventional shale oil and natural gas in the U.S. has led to a supply imbalance. Saudi Arabia has decided to inflict a lesson on the upstart E&P producers by allowing the price of oil to collapse, thus rendering so many of these new plays uneconomic with the presumed long run objective of regaining a more dominant market position in the future as the newbies are forced to cut production. The Saudis are playing the long game.

There’s little doubt that increased North American production has led to the supply/demand imbalance. In terms of the Saudi objectives, I’ll leave it to others more oriented towards World Petroleum Supply Growth PAA June 2015conspiracy theories to speculate. What follows is an insight drawn from production and price data.

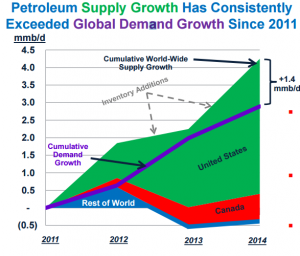
The first chart is from an investor presentation by Plains All America (PAA) several months ago. We’ve used it once before. Global oil demand has been growing at around 1 MMB/D (million barrels per day) for the past few years, and the increase in supply necessary to meet this has come entirely from the U.S. and Canada. As we know, the increase in supply has in fact been more than was needed to meet growing demand, hence the price collapse.

Sources of oil supply are not static. Oil fields achieve peak production and then face a steady drop. The argument about Peak Oil has revolved around the ability of E&P companies to replace what’s being used. Decline rates, which are the rate at which production drops, vary around the world, but the consensus is that we currently face decline rates of 5-6%. For example, the UK Energy Research Center issued a report in 2009 which supports this type of assumption. Although more recent analysis would be good, the numbers are unlikely to have shifted that much. If anything, because tight oil (i.e. shale) has faster than average decline rates the global decline rate may even be modestly higher.

In other words, today’s oil fields globally can be expected to produce 5-6% less next year than this. The shortfall plus the demand growth (roughly another 1.5%) is made up by new discoveries coming on stream. Obviously we’re getting rather better at covering this shortfall, which is inconvenient to say the least if you rely on high crude prices. Saudi Arabia, Russia, Venezuela and many E&P companies are worse off, while the rest of us are better off. Energy sector investors may not feel quite so sanguine, but regular readers are already bracing for another plug for MLPs. You will not be disappointed. Oil Curve August 2015

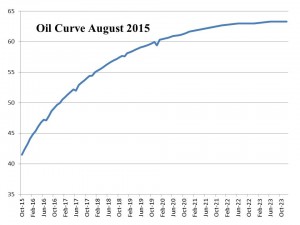
Now consider the oil futures curve. Regardless of whether or not it represents a  correct forecast, it does reflect the aggregate opinion as expressed through hedging activity of all the participants in the oil business. The key point to note here is that even when you look beyond the spot price of around $40, crude oil (this is a chart of WTI; Source: CME Group) is priced at $60-65 five or more years out. This is the price that market-driven investment decisions should be based on when evaluating new projects.

Oil charts don’t speak, but this one does contain more information than simply the forward price. In any market, the price of the commodity must lie at the cost of the marginal producer. Economic theory holds that at $60-65 there will be just enough economic profit to induce production of the last barrel of oil necessary to ensure supply satisfies demand. It’s not just spot oil that has fallen, but the entire oil curve. A year ago the five year out price was $90-$100. Interestingly, for the last few years this price was not far above where many believed the breakeven cost of U.S tight oil production in the major U. S basins thus naming them as the marginal (high cost) producer.

So consider where this marginal barrel of oil is going to come from. At $100 oil, all of the increase in supply for the past few years came from North America. The rest of the world was, in aggregate, unable to increase production by anything other than what it took to offset decline rates. That was at $100. Logically, the rest of the world will do no better at new production with the reduced inducement of $60. In fact, one of the few places in the world where production costs are falling is in North America, specifically across many of the shale pays in the U.S. Shale marginal costs have uniquely moved lower in step with the oil price forward curve and are now under $60/barrel as infrastructure build out into the plays has lowered costs along with reduced drilling & completion costs and improved well productivity.

If domestic oil production in the U.S. is expected to be choked off by uneconomically low prices, the oil curve should be far steeper. The price five years out should reflect the marginal cost that would prevail with a substantially smaller contribution from the U.S. If the Saudi strategy (for you conspiracy theorists) is working, the forward price five or more years out ought not to be much lower than it was a year ago, since you would assume most commercially driven shale producers would be unwilling to sustain operating losses over this time.

But the forward price is not at $100, and if you then ask where much of the new supply will come from to replace decline rates plus new demand, the answer has to be the same place net new supply has been coming from, which is the U.S. And don’t forget that falling oil prices have also led to a demand response as it’s cheaper to drive and refineries are running at very high levels of utilization. The inevitable conclusion from the oil curve is that the U.S. will gain market share, because the price curve can only plausibly accommodate the recent source of increased supply as the marginal supplier. Therefore, if you’re in the U.S. energy infrastructure business, this expected increase in market share for domestic production must be a good thing.

Of course, an alternative interpretation is that the U.S tight oil is unable to grow production enough to cover the difference and the forward oil price is then too low. I imagine Saudi Arabia must believe, or at least hope, that this is the case. If $40 reduces enough investment by domestic E&P companies such that U.S. oil production falls, the forward price will rise to where non-U.S. producers can provide the marginal barrel. But as the first chart shows, the price that prevailed from 2011-2014 wasn’t high enough to induce such activity. Moreover, costs for shale plays are falling rapidly as E&P companies squeeze service providers for lower pricing. The Saudi strategy, if there is one, is too late.

So either the U.S. will gain market share in the global oil market, or the forward curve is wrong. Neither outcome seems that bad for MLP investors, who benefit by building the infrastructure to handle increasing production..

I often note that my partner Henry is responsible for most of our good ideas and none of the bad ones. So if you like this insight, credit him, and if you think it’s off the wall you should assume it was my idea.


MLPs Now Look Attractive Relative to Equities

A persistent problem for investors is constructing a balanced portfolio with an acceptable risk/return profile when Fed policy has rendered bonds an impractical component. Indeed, much of our business at SL Advisors revolves around providing solutions to this problem. High yield bonds, the closet equity refuge of many fixed income investors willing to move out along the risk spectrum somewhat, have long been bested by Master Limited Partnerships (MLPs). In fact, we’ve often shown clients that MLPs can be a great substitute for High Yield since it’s the asset class with which they’re most highly correlated whereas their returns have been much higher and are likely to remain so.

However, the use of MLPs as a fixed income substitute has not looked so clever of late. The asset class sported a -32% total return from its peak a year ago until very recently. Following a modest bounce, MLPs are now 28% off their all-time highs (including distributions), and -17% YTD. Only 2008 was a worse time to be an MLP investor, and pretty much everything was going down then whereas the broader equity indices are currently close to all-time highs. So one must concede that the case for using MLPs as a fixed income alternative has been weakened as a result of their correlation with crude oil and its concurrent 50% slide.

Although MLP prices have fallen, distributions have continued to grow. Credit Suisse recently noted that midstream MLPs had increased their distributions at 7.8% year-on-year. The yield on the Alerian Index now exceeds 7%. This set of circumstances makes MLPs now a compelling equity substitute, given the return prospects.

In constructing a portfolio, each asset class requires an expected return, volatility and co-variance with the other asset classes. These three inputs allow for a forecast portfolio return to be estimated along with the range of possible outcomes. Of course it’s only as good as the inputs. In such an exercise, expected bond returns would have to be 1-3% since that’s where yields are today. Public equities have a wider range of plausible returns. Given the 2% dividend yield on the S&P500 and 5% dividend growth (the fifty year average), a 7% total return (i.e. dividend yield plus growth) is an acceptable long run forecast of equity returns although reasonable people could certainly differ over this.

This is where MLPs can represent an alternative, not necessarily to the fixed income allocation since their recent volatility has weakened the case as noted, but to the equity component. The price drop in MLPs has raised their expected return, since distributions have continued to grow. The 7% yield on MLPs compares favorably with the expected return on public equities noted above without any assumed distribution growth for MLPs. Over the last ten years, MLP distributions have grown at 7.4% annually, similar to the last year. Even assuming growth of half that level, you still get a 10% total return.

For the long term investor willing to look beyond near term price gyrations, the case for using MLPs as an important component of the equities portion of a portfolio is starting to look compelling.


MLPs Misbehaving

I’m currently reading Misbehaving: The Making of Behavioral Economicsby Richard H. Thaler. It’s a fascinating book that tells the story of the development of Behavioral Economics as a discipline, and a constant theme is the ongoing debate with his academic colleagues who adhere to the Efficient Markets Theory (EMT). Basically, EMT holds that security prices reflect all the available information and are therefore “correct” in that there’s nothing to be gained from trading or even holding an undiversified portfolio. All market participants are assumed to be perfectly rational, or at least the emotional ones are assumed to be irrelevant, perhaps because their irrational behavior has bankrupted them. Lots of people disagree with this informally, as evidenced by the enormous volumes of trading that take place every day. By contrast, Behavioral Economics as a field holds beliefs that are directly at odds with EMT, and its development has spurred a lively debate between the two camps. Behavioralists acknowledge that market participants are human and therefore make human, irrational decisions regularly. Exhibit One in the case against EMT might be the 1987 stock market crash when equity markets dropped over 25% in a single day without any meaningful news. If a stock price reflects the net present value of all the future cashflows derived therein, did their aggregate value truly fall by over a quarter one day? Few would argue that they did.

Less dramatic examples of this EMT violation occur regularly. In fact, I was reminded of this just last week during another period of falling MLP prices. Earnings reports from the sector have generally been unsurprising and solid, although this has not stopped prices from falling. Last week Plains All American (PAA) reported earnings that were only marginally weaker than expected. However, during the subsequent conference call PAA CEO Greg Armstrong warned that it was possible PAA would hold its distribution flat (i.e. not grow it as is the norm) so as to allow their distribution coverage to return to more conservative levels.

This was clearly a mildly negative comment, a piece of fundamental news that might well justify a modestly lower price for PAA and its General Partner Plains GP Holdings (PAGP). Investors and traders (sometimes they seem synonymous) reacted by driving the prices of both securities and the MLP sector down relentlessly. PAA finished the week 15% lower, and PAGP an astonishing 31% lower. Plains has one of the most respected management teams in the industry and a reputation for conservative stewardship. Our interpretation of the call was that flat distribution growth was a downside case rather than their guidance: possible, but not currently their Base Case. However, market prices moved to levels that reflect a far more dire outcome, pushing the yield on PAA up over 8%. PAGP meanwhile, which has no net debt and participates in PAA’s growth without ever having to provide capital to fund it, yields over 5% which is not such a bad return even if the distribution never grows. But it assuredly will as PAA grows its EBITDA and drops new projects into production. PAGP is like a hedge fund manager with permanent capital. They will continue to share in the cashflows generated by PAA for as long as they like, and PAA’s equity can never be withdrawn (i.e. investors can sell in the secondary market but they can’t force PAA to shrink), We are invested in PAGP.

Other MLP GPs reacted poorly, and the Alerian Index duly reached a more than 30% drop from its highs of a year ago. Under these circumstances, a long time MLP investor’s thoughts might understandably turn to another violation of the Efficient Markets Theory.

I have to say that we have selected our clients well — or more accurately, they have self-selected well.  Our Separately Managed Account investors in our MLP strategy, most of whom have been with us for years, have reacted to developments with equanimity. Our ability to at least lose a good bit less than the index no doubt helps (past performance is not indicative of future returns). In a number of cases we have been asked to invest additional capital and open new accounts, reflective of the long term nature of the opportunity as well as the outlook of our clients.

It’s unfortunately no longer an original thought to state on this blog that MLPs are attractively priced, and regularly falling prices can challenge the conviction of those who rely on rising prices as a validation of their investment thesis. The market is being inconveniently uncooperative in endorsing the actions of more recent investors. However, the development of U.S. oil and gas resources will assuredly continue; operators with strong balance sheets and patient investors without leverage will in our opinion eventually benefit, as in the past. We continue to like our investments.

On a different topic, recently The Economist magazine weighed in on the hedge fund debate in an article titled Fatal Distraction. Readers may recall my book, The Hedge Fund Mirage, published way back in 2012 in which I showed that virtually all the gross profits earned by hedge funds had gone in fees to managers and funds of hedge funds. The Economist was one of several mainstream financial publications that reviewed my book positively. They even went so far as to check the spreadsheet I had built to calculate returns and fees, a step no other publication took and one which cemented their place atop my list of most trusted news organizations. Hedge fund returns have not been good since then, as I expected. Even beating a simple 60/40 stocks/bonds portfolio has been beyond the hedge fund averages since 2002 — not only for the past thirteen years but every single year too. 2015 is shaping up to be no different. The Economist correctly challenges hedge fund proponents on their consistent mediocre results delivered at great expense.


An Apocalyptic Fund Story

The Four Horsemen of the Apocalypse, as far as long term investment returns are concerned, are excessive fees, leverage, taxes and over-trading. Any one of these can be relied upon to eat into the results sought by the long term investor. Add an excess of all four and you wind up with a toxic brew that impedes reaching your investment goals and can seriously impair your capital. We recently came across a security which incorporates all of them, and it provides a startling reminder of just how relentlessly capital can be destroyed when these four villains are able to work in concert together. As you’ll see, they have wrought an investment disaster of biblical proportions.

The Cushing MLP Total Return Fund (SRV) stands as a testament to much that is wrong with some of the investment products on offer. Although I often write about Master Limited Partnerships (MLPs), this fund’s focus on our favorite asset class is incidental to the story. The lessons herein apply to any investment.

To begin with, SRV is a closed end fund (CEF). This is an intriguing backwater in which we once dabbled before concluding that there wasn’t enough liquidity to justify the time. CEFs are like mutual funds except that their share count is fixed; consequently, price and Net Asset Value (NAV) can and invariably do deviate from one another. One of the enduring mysteries of the CEF business is why anybody buys Initial Public Offerings (IPOs). With admittedly unfortunate timing, on August 27, 2007 Morgan Stanley led an underwriting of 8.75 million shares of SRV at $20, of which $0.94 went in underwriting fees. So investors were immediately down 4.7% on their investment, and could have chosen to avoid the excitement of the IPO and buy SRV the following day (presumably 4.7% cheaper if it traded at NAV). After all, this was not Google, but simply a fund holding other publicly listed securities. But the machine worked, as it usually does, and investors were duly parted from a modest portion of their funds in exchange for misplaced hope.

SRV is organized as a corporation rather than as a Registered Investment Company (“RIC”), and I’ll spare readers detail of the consequences other than to note that SRV expected to pay 35% of its returns to the U.S. Treasury as corporate income tax (since it is a corporation). SRV planned to use up to 40% leverage, relying on the leverage-magnified returns to cover most of the tax. This only really works when a security such as SRV only goes up, but to point out this possible flaw seems small-minded in the face of such boldness.

The 2008 financial crisis was just months away. The demise of Bear Stearns, collapse of Lehman and government bailout of AIG led many to pray for investment relief. They were dark days indeed. For comparison, we are going to consider SRV’s returns against two other indices; the Alerian Total Return Index (AMZX), and a customized index reflecting SRV’s structure, which uses AMZX with 40% leverage, a 35% tax rate, and 5% expenses (all assumptions lifted from the 2007 prospectus). We’ll call this the Alerian Stupid (AMZS) in honor of the hapless souls who aspired to its results.

In spite of the storm clouds in 2007, the AMZX returned 3.3% for the remainder of the year following SRV’s IPO, and even the AMZS was +1.7%. However, SRV left its initial investors smarting with a -14.4% reduction in the value of their investment. Worse was to come, and markets plunged in 2008 with AMZX delivering         -36.9%. AMZS was only slightly worse, at -37.4%. While leverage amplified the losses, the tax burden is assumed to work as a benefit in a down market rather like a net operating loss (those interested in more detail can find it on our blog under The Sky High Expenses of MLP Funds). SRV quickly parted company with these indices, and turned in an eye-popping -69.3%. CEF experts may note that many closed end funds moved to a substantial discount to NAV in 2008 which exacerbated the fall in price many suffered. However, Morningstar  shows that SRV remained at a premium to NAV fNewsletter August 2015 Chartor most of the year and indeed throughout its life until the end of last year. CEFs usually trade at a discount to NAV and many individual investors trade them seeking to exploit this fact. The consistent premium at which SRV has traded reflects optimism by investors tragically not repaid by results.
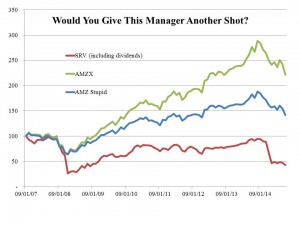
In 2009 markets roared back, and SRV delivered an astonishing +118.6%, well ahead of AMZX at +76.4% and AMZS at +60.2% (taxes really hurt that year). Emboldened by this performance, SRV investors drove the premium to NAV up during the year and by early 2010 it reached 40%, an apogee of irrational exuberance that causes wistful nostalgia in today’s investors. At this point Cushing, aided by a different set of underwriters, sensibly exploited the premium by announcing a secondary offering of 6 million shares priced at $10, half the level of the IPO. A 2011 supplement to the 2010 prospectus also revealed portfolio turnover of 301% in 2010 and 526% in 2009 (high turnover is our fourth horseman). Holders of SRV may have thought they were investors, whereas the data suggests a manager frantically trading with little evidence of any thoughtful strategy.

The years since have not been kind to the faithful (and their composition has changed via trading in the secondary market). Inconveniently, SRV has not risen consistently in price so as to most effectively avail itself of the benefits of leverage. The annual return from inception to June 2015 is -10.2%, compared with +4.6% for AMZS and 10.7% for AMZX. It shows the enormous difference between selecting the right asset class (since MLPs have done very well) and the wrong instrument.

The result is that today SRV languishes at $3.45, a country mile from its IPO price and at a discount of over 20% to its NAV. In 2015 MLPs have of course been weak, but the discount suggests that the level of enthusiasm for the stewardship of this fund has finally conceded to the reality of truly awful performance. The financial equivalent of Conquest, War, Famine and Death symbolized by the Four Horsemen have surely been visited upon the holders of this fund. Defenders might find fault with picking on an investment launched back in 2007, at a time when perhaps underwriting standards were lower. They might care to consider the Cushing Royalty & Income Fund (SRF), launched in 2012 and having lost 77% for investors since then for a -34% annual return. Obviously they have found a formula that works, after a fashion.

I have heard reports that a new portfolio strategy has been put in place for SRV and that prospects are better than in a long while for those investors willing to cast the past aside. There will probably be some – for although underwriters deserve blame for bringing poor products to market, self-destructive behavior by investors is also necessary to produce stories such as this one. The right thing for Cushing to do is liquidate the portfolio and buy back shares, thus ending a sorry chapter for an MLP manager that has produced ample wealth for its founders if not always for its investors. At least the remaining faithful would profit from the closing of the NAV discount. However, closed end funds represent permanent capital, in that they generate fees in perpetuity for the manager, and winding the fund up is never going to be as appealing to a commercially-driven operator as trying again with a new set of investors.

Even with the benefit of hindsight, it’s hard to fathom just how the underwriters and manager of SRV ever expected to generate acceptable returns. The tax drag, leverage, fees and subsequent turnover represented a formidable headwind, as shown by the difference between AMZX and our customized index, AMZS. Although SRV appeared just prior to a tumultuous time, overall asset class returns during its life have been good; better, perhaps, than those involved in its creation might have hoped in 2007. It was a structurally flawed security, and its existence reflects poorly on all the firms who have been associated with it. I recently chatted with a friend who was considering entering investment management but worried that he did not possess a sustainable investing edge. His caution was reasonable given his desire to offer a value-added service. However, as I pointed out to him, in some places the bar is set pretty low.


MLP Earnings Provide Update on Fundamentals

Energy investors have seen their holdings buffeted of late by the price of oil, and Master Limited Partnerships (MLPs) have been no exception to this. Their prices have moved as if they have substantial exposure to oil, whereas midstream MLPs are most notable for their cashflows being predominantly fee-driven. Over the past few days several firms reported quarterly earnings, showing business operations that are far less exciting than their security prices suggest.

Before we get to that, it’s worth contrasting recent news on planned capital investment from Royal Dutch Shell (RDS) with plans at Kinder Morgan (KMI). RDS announced they were cutting 6,500 jobs (out of a total workforce of 94,000) and reducing their planned capital spending by $7BN (to $30BN) as a result of weak oil prices which they expect to persist. There is a substantial timelag between shifts in the price of oil and changes in supply, but here’s one example of a reduction in future supply in response to lower prices. Kinder Morgan (as we noted in a previous blog post Kinder Morgan Isn’t Greek) recently increased its backlog of projects from $18.3BN to $22BN during the most recent quarter (these cover several years so longer than the one year over which RDS cut its planned investments). Both companies are in the Energy sector, and yet they’re experiencing the fluctuations in oil prices very differently.

To return to recent earnings, results from the companies we care about were generally good. Williams Companies (WMB) affirmed its 10-15% dividend growth through 2020 and currently yields 4.8%. Enterprise Products Partners (EPD) raised its distribution by 6% year-on-year and yields 5.25% with very conservative 1.3X coverage. Western Gas Equity Partners (WGP), the General Partner for Western Gas, LP (WES), increased its distribution by 34% year-on-year and reaffirmed its outlook for 30% growth going forward. It yields 2.5%. Finally, U.S. Silica (SLCA), whose main business provides sand to companies for use in fracking, saw its revenues fall 28% and sand volumes drop 13%, less than expected, resulting in a 15% jump in its stock price on the day of the release (although admittedly it remains lower than we originally expected.

In short, fundamentals on individual names are showing that the energy infrastructure business remains sound in spite of the weakness in their stock prices. Everybody would like to know when prices will rise; while we can note several solid earnings reports and can opine on business conditions, calling equity markets is hard. But the news we received over this past week was positive.