The Shrinking Pool of Cheap Assets
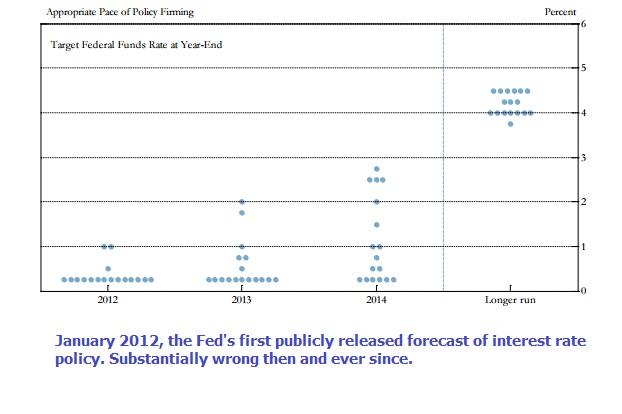
Stocks have in recent years been the destination of choice for bond refugees. The guiding strategy behind monetary policy since 2008 has been to drive investors into riskier assets so as to boost economic growth. Amid mounting evidence that this objective was being achieved, the Federal Reserve has contemplated the timing around ending this strategy by normalizing rates. In fact, the Federal Reserve has provided so many false warnings of an impending tightening of monetary policy that it’s barely worth paying attention. I have kept track of their evolving rate forecasts ever since they began providing greater precision back in January 2012. The chart of “blue dots” represents individual FOMC members’ expectations for the Fed Funds rate. Four and a half years ago they kicked off this greater openness with a forecast of a single tightening that year and a 0.75% rate by 2014. It’s fair to say that in early 2012 none of them expected the August 2016 funds rate to be where it is at 0.25%. Ever since they started with the blue dots, they’ve strained to adapt their updated forecasts to their persistent inaction. It has been an amusing if not especially informative spectacle. You’d think it would be easier to get it right than the record suggests — they are, after all, merely trying to forecast their own actions. However, tactics regularly overwhelm strategy, as a moment of weakness in any sector of the economy is extrapolated into the possibility of a disappointing GDP number. If you look hard enough, there’s always softness somewhere. FOMC members possess many skills, but good forecasters they are not.
Not everyone has been surprised by the lethargic return to “normal” interest rates. Since it is the political season (i.e. shameless self-promotion is all around us), back in 2013 your blogger noted high levels of public debt and concluded that, “As a society we want low rates, and the Federal Reserve is pursuing a set of policies that are clearly in the public interest.” See Bonds Are Not Forever; The Crisis Facing Fixed Income Investors (Wiley, 2013).
Consequently, interest rates have remained lower for far longer than most investors expected. Every fixed rate mortgage has turned out to be more expensive than going with an adjustable one. Every non-defaulting corporate bond issued was, in hindsight, more costly than relying on floating rate debt. Eventually a borrower somewhere will lock in an all-time low in rates, but it hasn’t happened yet.
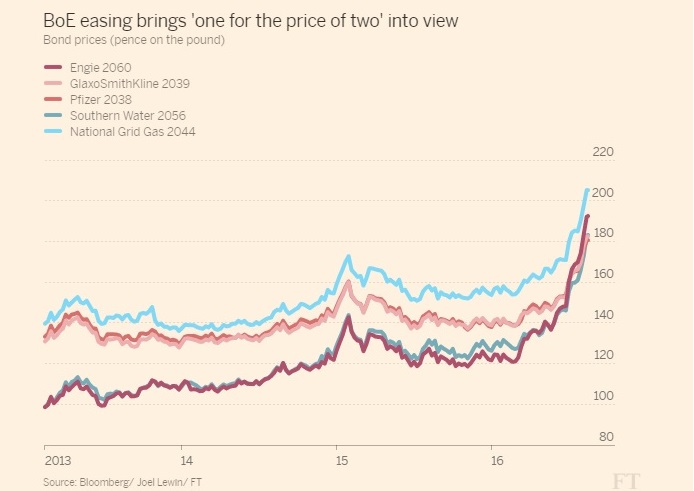
It’s not hard to find examples of strong performance in bonds, but even by recent standards I found the chart below from the Financial Times striking. The UK may have voted itself a recession via Brexit, but among the winners are holders of long-dated Sterling denominated corporate bonds whose prices in some cases have reached two times their par value at maturity.
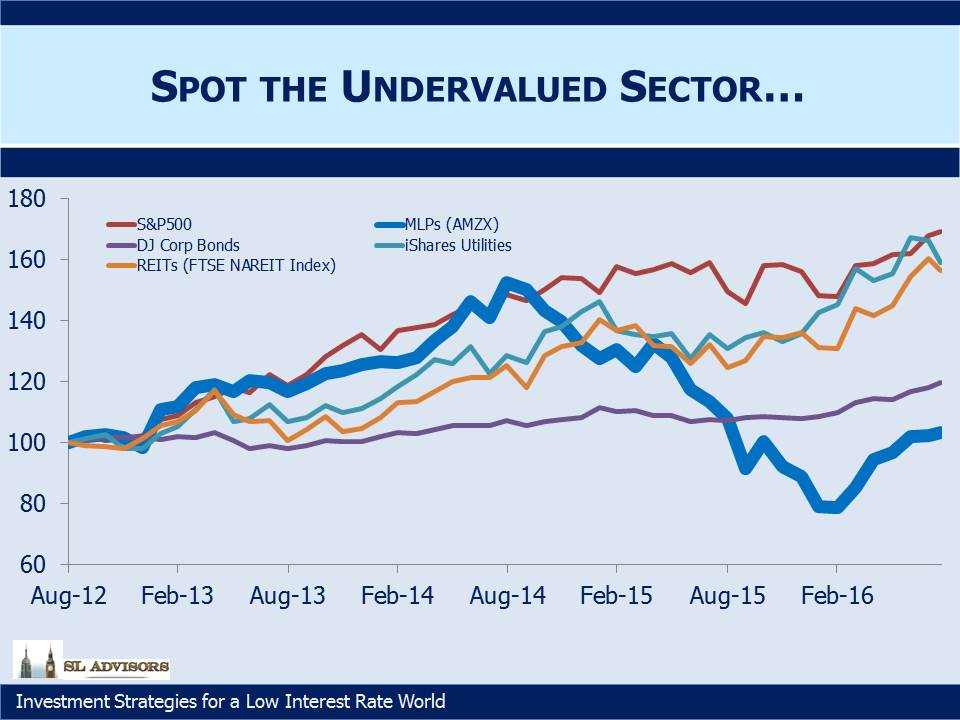
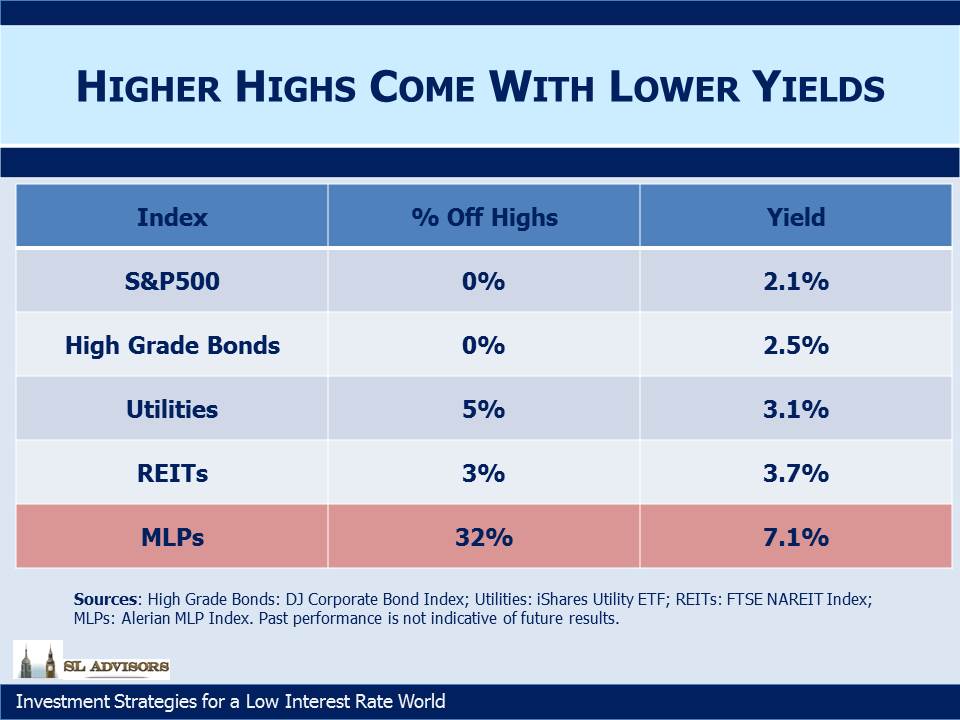
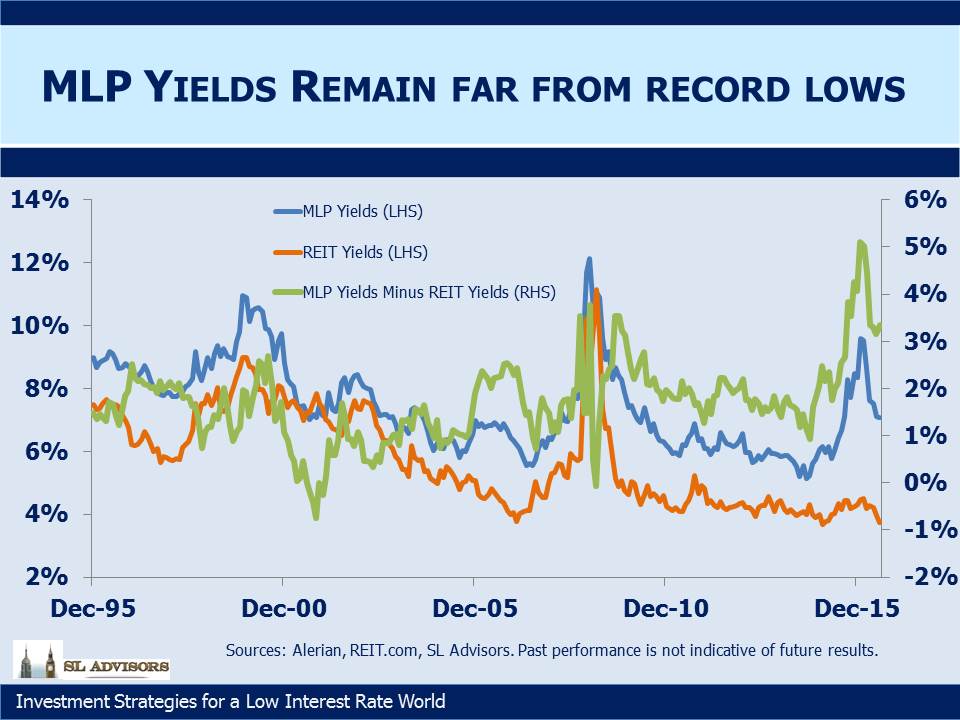
Because of continued central bank monetary accommodation, the indices touching new highs are many and varied. Stocks, bonds, utilities and REITs are all at or very close to all- time best levels. As a result their yields are all commensurately paltry, as one might expect. By comparison, energy infrastructure, as represented by the Alerian MLP Index, offers both a substantially higher yield and a meaningful discount to its former high. With so many asset classes trading at hitherto unseen levels, it’s increasingly difficult to identify pockets of value. Momentum investors of course have plenty of choices, since so many sectors have strong upward momentum. MLPs have been no recent laggard on this score either, having leapt 60% from their low this past February. But it seems to us that if you like your investments to offer some kind of value cushion for when the momentum inevitably turns, MLPs should hold your attention. The yield spread between MLPs and REITs remains close to the widest levels it reached during the 2008 financial crisis. Switching from REITs or Utilities into MLPs looks like a portfolio upgrade.