Oil Forecasters Have to Work Harder
Those in the oil industry who take a long view increasingly worry about insufficient new supply. It’s hardly today’s problem, with crude oil back to the mid $40s as OPEC’s production cuts are offset by increased shale output. But depletion of existing fields is generally believed to take 3-4 Million Barrels a day (MMB/D) off the market every year and demand continues to increase by 1-1.5 MMB/D annually. As a result, 4-5MMB/D of new supply is required annually to balance the market. Global production is currently around 97 MMB/D.
Last week Amin Nasser, chairman of Saudi Aramco, noted that the 20 MMB/D of new production thus needed over the next five years is unlikely to be forthcoming from U.S. shale, or indeed anywhere else. The International Energy Agency (IEA) offered a similar outlook.
The short-cycle nature of shale is likely impeding new development. In the past, the supply response function of crude was quite slow in reacting to demand changes, which contributed to some extreme price volatility. Since bottoming 18 months ago crude has been more stable. The ability of shale producers to alter production in just a few weeks or months is contributing. It also means that backers of a new, conventional project have to consider the impact on their returns from a repeat of the 2015 oil collapse, since much of the U.S. shale industry was able to protect itself by reducing output.
In the competition between short-cycle and long-cycle, the former’s flexibility represents a significant advantage. It means some projects that might ultimately turn out to be profitable aren’t getting approved.
This is one of the reasons that JBC Energy forecasts an extra 1MMB/D of shale oil output by the end of next year. This would take overall U.S. crude output over 10 MMB/D, to around the same level as Saudi Arabia.
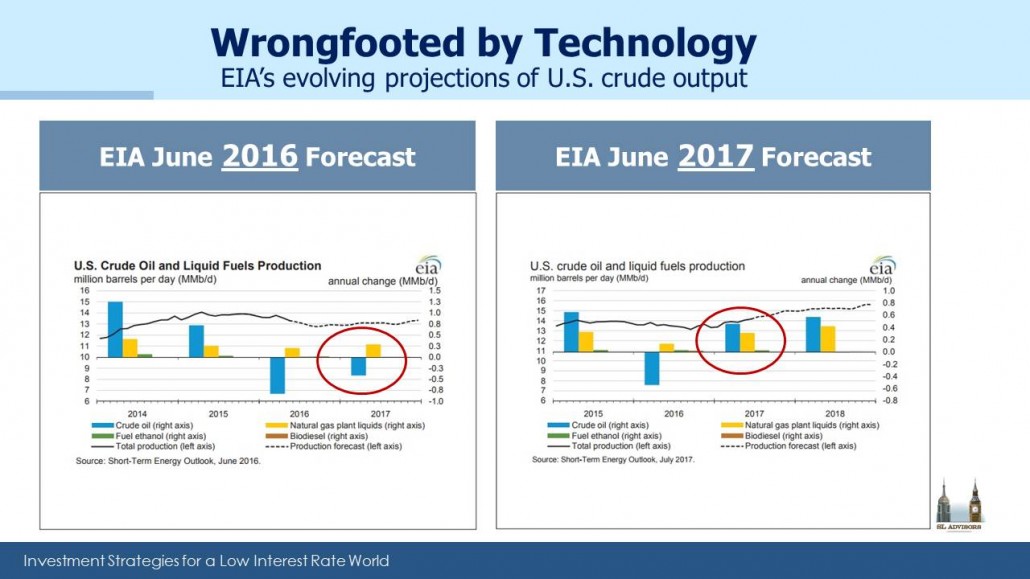
The U.S. Energy Information Administration (EIA), agrees, recently projecting 9.9 MMB/D of average output next year which would correspond with JBC Energy’s 10 MMB/D 2018 exit rate. This will be the highest annual average production in U.S. history, surpassing the previous record of 9.6 MMB/D set in 1970. It’s worth noting that one year ago the EIA was forecasting a decline of 0.4 MMB/D to 8.2 MMB/D for 2017 production, while they’re now projecting a 0.6 MMB/D increase to 9.3 MMB/D. The size of the 1 MMB/D revision over twelve months reflects the dramatic improvements in productivity across the industry (and maybe, ahem, poor forecasting).
A recent example is Devon Energy’s record breaking well drilled in Oklahoma which produced 6,000 barrels a day equivalent of oil and gas during its first 24 hours of operation.
U.S. shale output is set to grow and is becoming the swing producer, quickly responding to price signals and as a result keeping oil prices in a fairly narrow range. Prices may be lower than producers globally would like, but they’re high enough to stimulate increased domestic production, which is what the owners of midstream infrastructure care about. Impressive as these gains are, they’re not going to meet the supply shortfall that Saudi Aramco’s Nasser and others see on the horizon. But it’s hard to see how that problem can be anything but good for the U.S. and MLPs.

Important Disclosures
The information provided is for informational purposes only and investors should determine for themselves whether a particular service, security or product is suitable for their investment needs. The information contained herein is not complete, may not be current, is subject to change, and is subject to, and qualified in its entirety by, the more complete disclosures, risk factors and other terms that are contained in the disclosure, prospectus, and offering. Certain information herein has been obtained from third party sources and, although believed to be reliable, has not been independently verified and its accuracy or completeness cannot be guaranteed. No representation is made with respect to the accuracy, completeness or timeliness of this information. Nothing provided on this site constitutes tax advice. Individuals should seek the advice of their own tax advisor for specific information regarding tax consequences of investments. Investments in securities entail risk and are not suitable for all investors. This site is not a recommendation nor an offer to sell (or solicitation of an offer to buy) securities in the United States or in any other jurisdiction.
References to indexes and benchmarks are hypothetical illustrations of aggregate returns and do not reflect the performance of any actual investment. Investors cannot invest in an index and do not reflect the deduction of the advisor’s fees or other trading expenses. There can be no assurance that current investments will be profitable. Actual realized returns will depend on, among other factors, the value of assets and market conditions at the time of disposition, any related transaction costs, and the timing of the purchase. Indexes and benchmarks may not directly correlate or only partially relate to portfolios managed by SL Advisors as they have different underlying investments and may use different strategies or have different objectives than portfolios managed by SL Advisors (e.g. The Alerian index is a group MLP securities in the oil and gas industries. Portfolios may not include the same investments that are included in the Alerian Index. The S & P Index does not directly relate to investment strategies managed by SL Advisers.)
This site may contain forward-looking statements relating to the objectives, opportunities, and the future performance of the U.S. market generally. Forward-looking statements may be identified by the use of such words as; “believe,” “expect,” “anticipate,” “should,” “planned,” “estimated,” “potential” and other similar terms. Examples of forward-looking statements include, but are not limited to, estimates with respect to financial condition, results of operations, and success or lack of success of any particular investment strategy. All are subject to various factors, including, but not limited to general and local economic conditions, changing levels of competition within certain industries and markets, changes in interest rates, changes in legislation or regulation, and other economic, competitive, governmental, regulatory and technological factors affecting a portfolio’s operations that could cause actual results to differ materially from projected results. Such statements are forward-looking in nature and involves a number of known and unknown risks, uncertainties and other factors, and accordingly, actual results may differ materially from those reflected or contemplated in such forward-looking statements. Prospective investors are cautioned not to place undue reliance on any forward-looking statements or examples. None of SL Advisors LLC or any of its affiliates or principals nor any other individual or entity assumes any obligation to update any forward-looking statements as a result of new information, subsequent events or any other circumstances. All statements made herein speak only as of the date that they were made. r
Certain hyperlinks or referenced websites on the Site, if any, are for your convenience and forward you to third parties’ websites, which generally are recognized by their top level domain name. Any descriptions of, references to, or links to other products, publications or services does not constitute an endorsement, authorization, sponsorship by or affiliation with SL Advisors LLC with respect to any linked site or its sponsor, unless expressly stated by SL Advisors LLC. Any such information, products or sites have not necessarily been reviewed by SL Advisors LLC and are provided or maintained by third parties over whom SL Advisors LLC exercise no control. SL Advisors LLC expressly disclaim any responsibility for the content, the accuracy of the information, and/or quality of products or services provided by or advertised on these third-party sites.
All investment strategies have the potential for profit or loss. Different types of investments involve varying degrees of risk, and there can be no assurance that any specific investment will be suitable or profitable for a client’s investment portfolio.
Past performance of the American Energy Independence Index is not indicative of future returns.
Leave a Reply
Want to join the discussion?Feel free to contribute!