Measuring Dividend Growth is Complicated
You’d think this would be a pretty simple issue. It’s certainly an important one. Equity investors derive their returns from dividends, dividend growth and capital gains. A simple estimate of long term returns on an equity security is to add the current dividend yield to expected dividend growth to arrive at the expected annual return. If the dividend yield remains constant then the security’s price will rise at the dividend growth rate, hence adding them together makes sense. It’s a shorthand, necessarily imprecise estimate; the dividend yield can fluctuate and the growth estimate can be wrong. Currently, the S&P 500 yields around 2% and dividend growth has averaged 5% for the past 50 years, so a 7% long term return estimate for U.S. public equities is defensible on this basis. Different assumptions will produce a different result.
But the devil is in the details, as you will see. Since much of what we do is in energy infrastructure, we look pretty closely at the Alerian Index as the benchmark for Master Limited Partnerships (MLPs). Growth in distributions (what MLPs call the dividends they pay) is a key component of total returns in this sector, so what have distributions done in 2015?
There’s more than one answer. You can derive a monthly dividend rate on the Alerian Index (AMZ) by multiplying its month end yield by its price. Using this methodology, adding up the last 12 months’ dividends and comparing with the prior 12 months gives a drop of -4.0%. If you estimate the last two months’ of 2015 to be at the same rate as October, you arrive at a full year 2015 figure of -6.0% versus 2014. Another estimate uses just the October 2015 payout rate compared with the prior October, and on this basis they’re down -9.5%. None of these figures are wrong, they’re just different measurements.
The chart shows distribution growth using the one year change in the monthly rate going back to 2007. Prior to the collapse in oil, growth was running at around 5% so the 15% deterioration in the AMZ growth rate is similar to the drop that occurred in 2008. This roughly matches the performance of the index, which by September 2015 had fallen 40.1% from its August 2014 high, roughly the same as its 41.1% drop from June 2007 to December 2008.
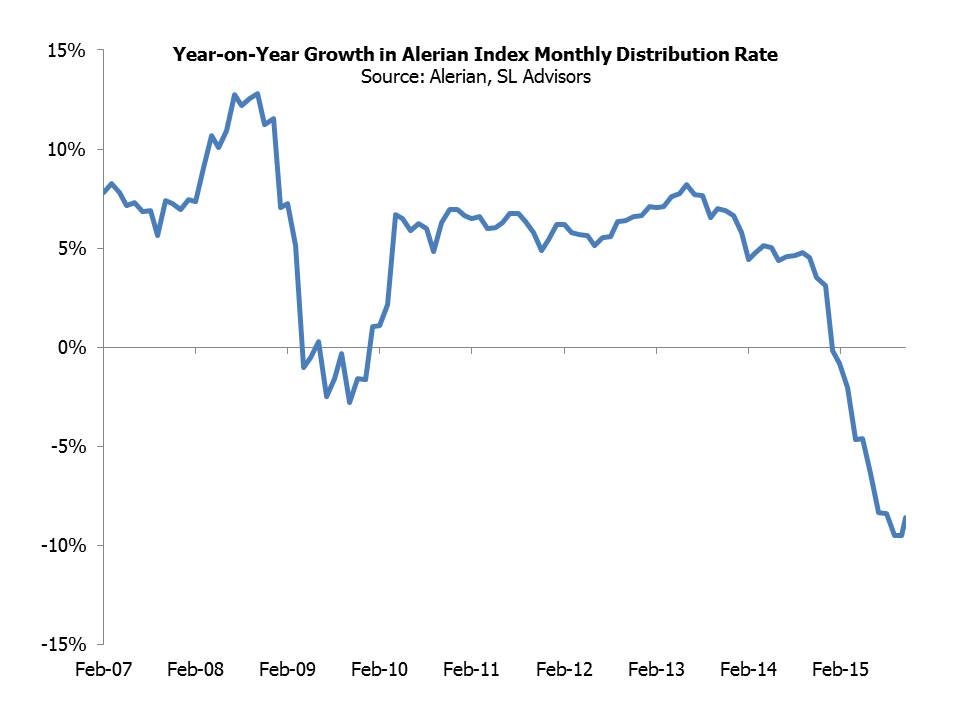
Veteran MLP investors may recall that AMZ enjoyed positive distribution growth through the financial crisis and be puzzled by the chart showing it was negative. In fact, full year 2009 distributions were 0.5% higher than full year 2008. The year-on-year change in the monthly distribution rate was -2.5% in July 2009. Incidentally, Alerian reports that 2009 growth was +3%. They measure this by taking trailing growth multiplied by the year-end weights of those securities in the AMZ. This doesn’t necessarily reflect the actual experience of investors in AMZ in 2009. Methodology counts for a lot.
The drop in distributions in 2015 has been driven by exploration and production names, many of whom have cut or eliminated their distributions. Upstream businesses are highly sensitive to oil and gas prices. Midstream MLPs have done rather better. The GPs of midstream MLPs have done better still. For example, in our Separately Managed Account strategy, actual cash distributions and dividends for 2015 are coming in at 15.7% higher than 2014. Part of this is driven by reinvestment of dividends, so reversing this feature to get to apples and apples results in 12% growth, 18% better than the equivalent for AMZ. The table below shows selected holdings of ours. We don’t expect growth at the same rate, but it illustrates the difference in operating performance of GPs compared with the AMZ.
| Name | Trailing 12 Month Distribution Growth |
| Energy Transfer Equity (ETE) | 37% |
| EnLinc Midstream (ENLC) | 11% |
| Kinder Morgan (KMI) | 16% |
| Plains GP Holdings (PAGP) | 21% |
| Targa Resources Corp (TRGP) | 24% |
| Williams Companies (WMB) | 14% |
Certain information herein has been obtained from third party sources and, although believed to be reliable, has not been independently verified and its accuracy or completeness cannot be guaranteed. References to indexes and benchmarks are hypothetical illustrations of aggregate returns and do not reflect the performance of any actual investment. Investors cannot invest in an index. There can be no assurance that current investments will be profitable. Actual realized returns will depend on, among other factors, the value of assets and market conditions at the time of disposition, any related transaction costs, and the timing of the purchase. Nothing herein is or should be construed as investment, legal or tax advice, arecommendation of any kind, a solicitation of clients, or an offer to sell or a solicitation of an offer to invest in a fund or funds. An investment in a Fund may be offered only pursuant to the Fund’s prospectus.