Listen to What The Oil Price Is Saying
The collapse in oil prices was the dominant story of 2014, and it’s shaping up to be the dominant story of 2015 too. In the popular narrative, development of unconventional shale oil and natural gas in the U.S. has led to a supply imbalance. Saudi Arabia has decided to inflict a lesson on the upstart E&P producers by allowing the price of oil to collapse, thus rendering so many of these new plays uneconomic with the presumed long run objective of regaining a more dominant market position in the future as the newbies are forced to cut production. The Saudis are playing the long game.
There’s little doubt that increased North American production has led to the supply/demand imbalance. In terms of the Saudi objectives, I’ll leave it to others more oriented towards 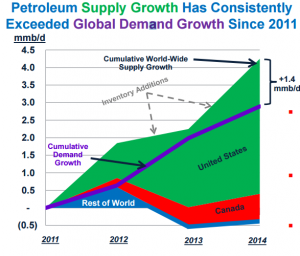 conspiracy theories to speculate. What follows is an insight drawn from production and price data.
The first chart is from an investor presentation by Plains All America (PAA) several months ago. We’ve used it once before. Global oil demand has been growing at around 1 MMB/D (million barrels per day) for the past few years, and the increase in supply necessary to meet this has come entirely from the U.S. and Canada. As we know, the increase in supply has in fact been more than was needed to meet growing demand, hence the price collapse.
Sources of oil supply are not static. Oil fields achieve peak production and then face a steady drop. The argument about Peak Oil has revolved around the ability of E&P companies to replace what’s being used. Decline rates, which are the rate at which production drops, vary around the world, but the consensus is that we currently face decline rates of 5-6%. For example, the UK Energy Research Center issued a report in 2009 which supports this type of assumption. Although more recent analysis would be good, the numbers are unlikely to have shifted that much. If anything, because tight oil (i.e. shale) has faster than average decline rates the global decline rate may even be modestly higher.
In other words, today’s oil fields globally can be expected to produce 5-6% less next year than this. The shortfall plus the demand growth (roughly another 1.5%) is made up by new discoveries coming on stream. Obviously we’re getting rather better at covering this shortfall, which is inconvenient to say the least if you rely on high crude prices. Saudi Arabia, Russia, Venezuela and many E&P companies are worse off, while the rest of us are better off. Energy sector investors may not feel quite so sanguine, but regular readers are already bracing for another plug for MLPs. You will not be disappointed. 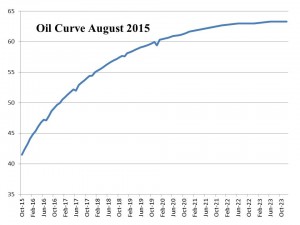
Now consider the oil futures curve. Regardless of whether or not it represents a correct forecast, it does reflect the aggregate opinion as expressed through hedging activity of all the participants in the oil business. The key point to note here is that even when you look beyond the spot price of around $40, crude oil (this is a chart of WTI; Source: CME Group) is priced at $60-65 five or more years out. This is the price that market-driven investment decisions should be based on when evaluating new projects.
Oil charts don’t speak, but this one does contain more information than simply the forward price. In any market, the price of the commodity must lie at the cost of the marginal producer. Economic theory holds that at $60-65 there will be just enough economic profit to induce production of the last barrel of oil necessary to ensure supply satisfies demand. It’s not just spot oil that has fallen, but the entire oil curve. A year ago the five year out price was $90-$100. Interestingly, for the last few years this price was not far above where many believed the breakeven cost of U.S tight oil production in the major U. S basins thus naming them as the marginal (high cost) producer.
So consider where this marginal barrel of oil is going to come from. At $100 oil, all of the increase in supply for the past few years came from North America. The rest of the world was, in aggregate, unable to increase production by anything other than what it took to offset decline rates. That was at $100. Logically, the rest of the world will do no better at new production with the reduced inducement of $60. In fact, one of the few places in the world where production costs are falling is in North America, specifically across many of the shale pays in the U.S. Shale marginal costs have uniquely moved lower in step with the oil price forward curve and are now under $60/barrel as infrastructure build out into the plays has lowered costs along with reduced drilling & completion costs and improved well productivity.
If domestic oil production in the U.S. is expected to be choked off by uneconomically low prices, the oil curve should be far steeper. The price five years out should reflect the marginal cost that would prevail with a substantially smaller contribution from the U.S. If the Saudi strategy (for you conspiracy theorists) is working, the forward price five or more years out ought not to be much lower than it was a year ago, since you would assume most commercially driven shale producers would be unwilling to sustain operating losses over this time.
But the forward price is not at $100, and if you then ask where much of the new supply will come from to replace decline rates plus new demand, the answer has to be the same place net new supply has been coming from, which is the U.S. And don’t forget that falling oil prices have also led to a demand response as it’s cheaper to drive and refineries are running at very high levels of utilization. The inevitable conclusion from the oil curve is that the U.S. will gain market share, because the price curve can only plausibly accommodate the recent source of increased supply as the marginal supplier. Therefore, if you’re in the U.S. energy infrastructure business, this expected increase in market share for domestic production must be a good thing.
Of course, an alternative interpretation is that the U.S tight oil is unable to grow production enough to cover the difference and the forward oil price is then too low. I imagine Saudi Arabia must believe, or at least hope, that this is the case. If $40 reduces enough investment by domestic E&P companies such that U.S. oil production falls, the forward price will rise to where non-U.S. producers can provide the marginal barrel. But as the first chart shows, the price that prevailed from 2011-2014 wasn’t high enough to induce such activity. Moreover, costs for shale plays are falling rapidly as E&P companies squeeze service providers for lower pricing. The Saudi strategy, if there is one, is too late.
So either the U.S. will gain market share in the global oil market, or the forward curve is wrong. Neither outcome seems that bad for MLP investors, who benefit by building the infrastructure to handle increasing production..
I often note that my partner Henry is responsible for most of our good ideas and none of the bad ones. So if you like this insight, credit him, and if you think it’s off the wall you should assume it was my idea.