Give Your Loved One an MLP This Holiday Season
This is the time of year when thoughts turn to family and the holidays, but as you plan your celebrations keep in mind that MLPs care about the seasons too. In fact, MLP returns exhibit a marked pattern driven by the calendar and the idiosyncrasies of their investor base.
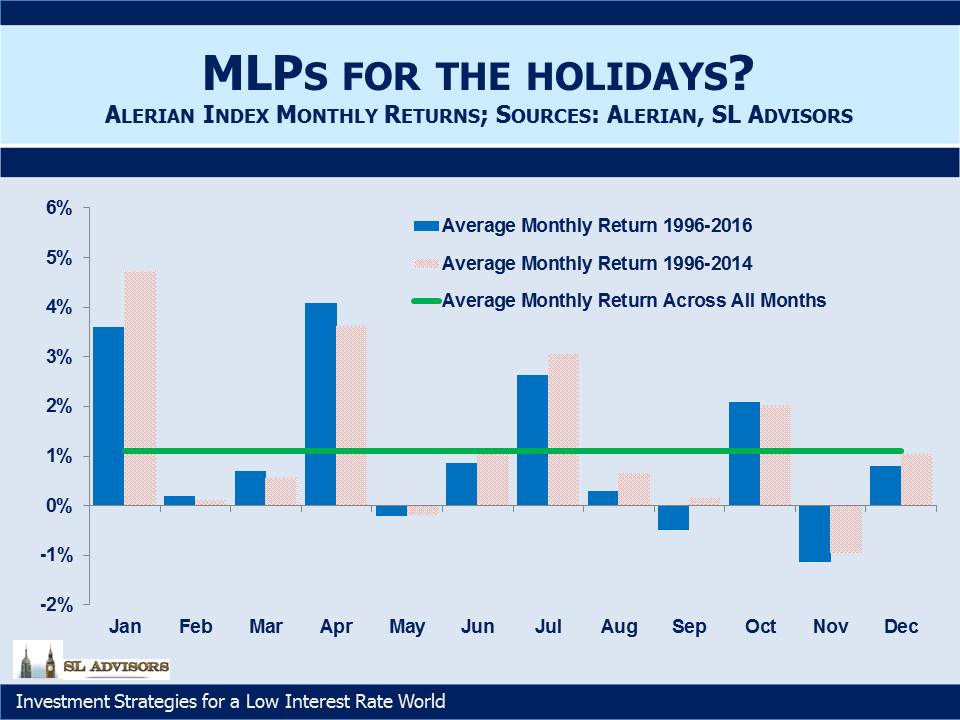
The chart below shows the average return for each month of the calendar year, and to illustrate how the 2014-15 bear market altered these, we’ve included what those averages were without the last two years. The most striking feature is that investing for just four months of the year gets you almost all the annual return. January, April, July and October are “distribution months”, the time when MLPs declare their quarterly distributions to holders of record (the actual payments typically go out a month later). Only those four months historically provide returns above the monthly average of 1.1%; so much above that the other eight months of the year in aggregate have provided less than a tenth of investors’ returns.
In theory an investor should be indifferent to whether a stock is about to declare a dividend or has just gone ex-dividend, but MLP investors love their distributions – irrationally so. The result is that there tend to be fewer sellers in those months as some holders opt to wait a little longer and receive that chunky payment.
.avia-image-container.av-20ev6p-6196cf5d3f7725db4b92c0c901fe21a2 img.avia_image{ box-shadow:none; } .avia-image-container.av-20ev6p-6196cf5d3f7725db4b92c0c901fe21a2 .av-image-caption-overlay-center{ color:#ffffff; }
The other clear pattern revolves around year-end. The power of distribution months wanes during the year, and is strongest earlier in the year when it combines with the turning of the calendar. K-1s are probably a factor here – clearly some investors contemplating a purchase of MLPs in November opt for delay so as to avoid the additional tax work of a K-1 for the last few weeks of the year. Similarly, selling before year-end rather than just after avoids an additional K-1 for a few weeks of exposure. Both factors tend to create more motivated sellers late in the year and more motivated buyers early in the new year. And many investors intersperse family time over the holidays with some personal portfolio analysis, at least some of which results in the decision to buy more MLPs in January.
Of course, seasonal patterns don’t always work, and in any one year the power of the prevailing trend can overwhelm these factors. Last year was an example, and January 2016’s -11% result was the worst of any January for the 21 years of the Alerian Index’s history. This one month was sufficient to turn April into the seasonally strongest period of returns, pushing January to #2. Nonetheless, January has been profitable 76% of the time since the inception of the Alerian Index in 1996.
But as long as the seasonal patterns are caused by something, they are likely to prevail more often than not. K-1s, investors’ attraction to MLP distributions and year-end planning all remain part of the financial landscape. Therefore, it’s worth paying attention to these because if you’re contemplating the timing of a buy or sell, understanding these forces could help you achieve a better result. As with many investment decisions, it’s worth bucking the trend. So November isn’t the best time to sell. For that, wait until the end of January or after the first month of the quarter.
Most obviously, if you expect to pore over your investment portfolio during a quiet moment in late December, anticipating your MLP purchase decision and executing it a few weeks earlier could brighten up your returns. And if you do follow this advice and present your better half with a seasonally informed MLP gift, you might want to include some bling too, in case the romance of a well timed security purchase is lost on her.