Extracting Supply Forecasts from Oil Futures
We thought it would be interesting to expand a little more on the notion that crude oil prices reflect the market’s confidence that oil in the future will be available on approximately the same terms as today (see Oil Futures Say Shale’s Here to Stay). The tool we’re using is the two year spread – the difference between the spot price of crude and the futures price two years hence. The chart below plots spot Brent crude and this two year differential. We used Brent because it’s more reflective of the global oil price. Until late 2015 U.S. crude oil exports were limited to Canada, so the U.S. benchmark WTI reflects some price distortions caused by the export ban. However, it broadly conveys the same information as Brent.
.avia-image-container.av-h8g6bs-2de7e2166e8b48bc020163e73e3027cc img.avia_image{ box-shadow:none; } .avia-image-container.av-h8g6bs-2de7e2166e8b48bc020163e73e3027cc .av-image-caption-overlay-center{ color:#ffffff; }
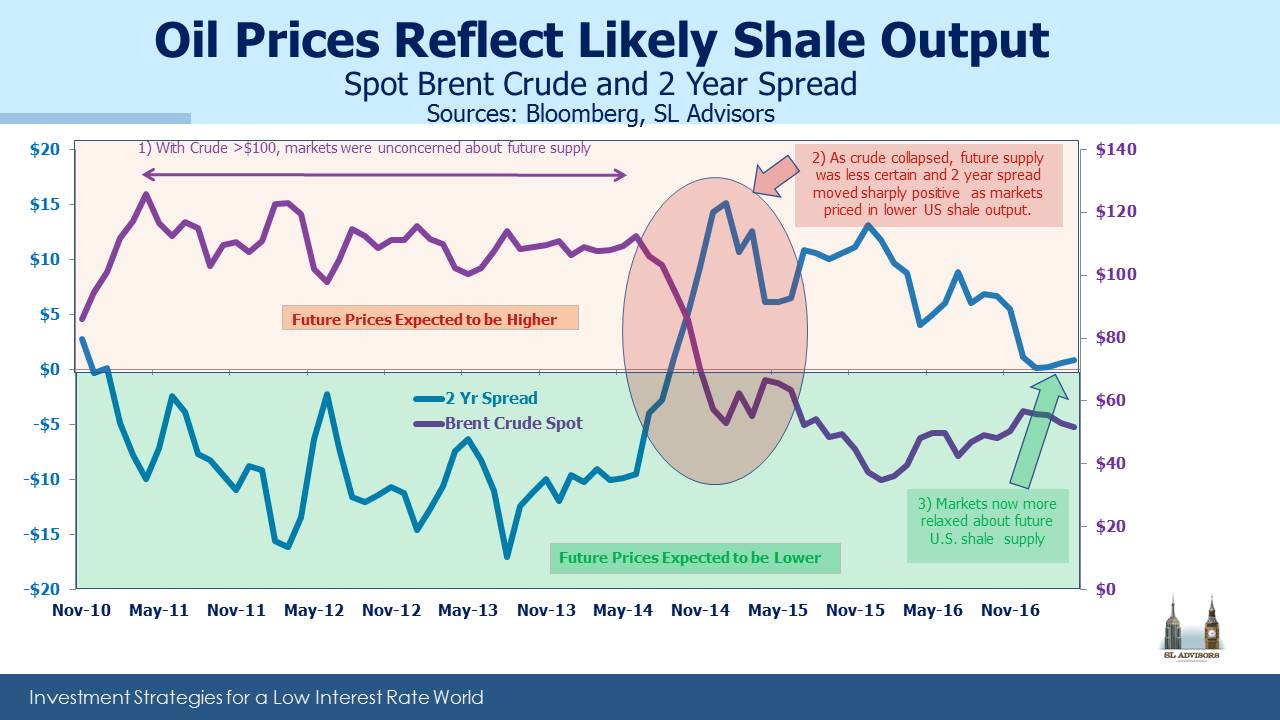
From 2010-2014, with crude oil above $100, the two year spread was negative (known as in backwardation). Crude futures two years out were trading at $5-$15 less than spot. This was the time of the great ramp up in U.S. shale output, and although export constraints kept it in the U.S. by reducing U.S. imports the global market felt its effects.
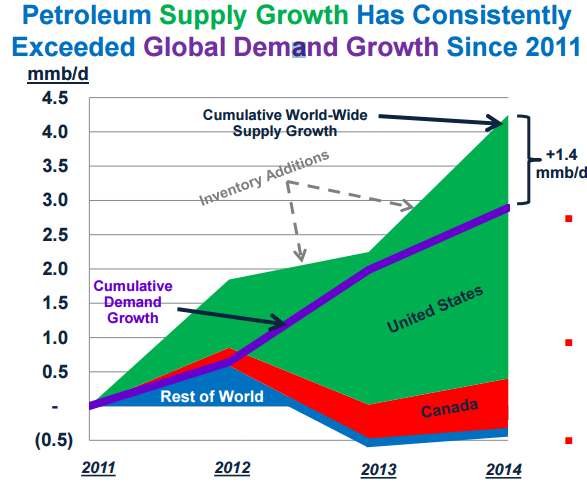
In 2014, Plains All American published a great chart which showed that North American output had been equivalent to fully all of the new global demand for crude oil over the prior four years. As we all know, OPEC responded to this concurrent loss of market share by allowing prices to collapse later that year.
.avia-image-container.av-1lotwo-cf62ff77a1c0dd16e9ce7641718a77c5 img.avia_image{ box-shadow:none; } .avia-image-container.av-1lotwo-cf62ff77a1c0dd16e9ce7641718a77c5 .av-image-caption-overlay-center{ color:#ffffff; }
As spot crude dropped, the two year spread moved sharply positive (known as contango). There are many factors driving the slope of the crude curve, not least of which is storage for near term contracts. High levels of inventories will tend to depress spot prices versus future ones, so the spread offers a guide with these caveats. With that said, two years ago the market was signaling that supply would only be available at sharply higher prices. The market was reflecting an expectation that OPEC’s strategy of bankrupting large swathes of the U.S. shale industry would be successful. Had it happened, the drop in supply would have allowed crude to return to substantially higher prices and vindicated OPEC’s strategy.
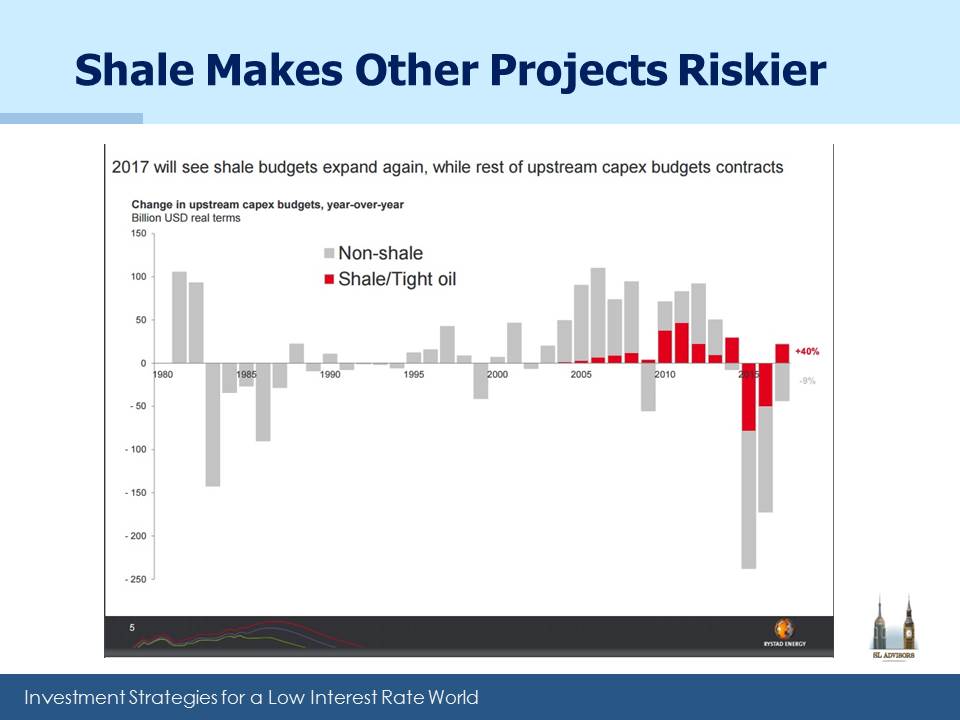
OPEC conceded defeat in November and agreed to cut production. This allowed prices to rise and in recent months has brought the two year spread back towards $0. Today’s oil prices reflect confidence that future supply will be available on roughly the same terms as today. Since capex commitments into conventional oil plays keep falling (see Why Shale Upends Conventional Thinking) and shale is bucking the trend with increased drilling budgets by the Exploration and Production (E&P) companies active there, a logical inference is that oil traders expect continued increases in shale output.
.avia-image-container.av-en54eg-1825563d43c2f969fbc0cd4179d26df5 img.avia_image{ box-shadow:none; } .avia-image-container.av-en54eg-1825563d43c2f969fbc0cd4179d26df5 .av-image-caption-overlay-center{ color:#ffffff; }
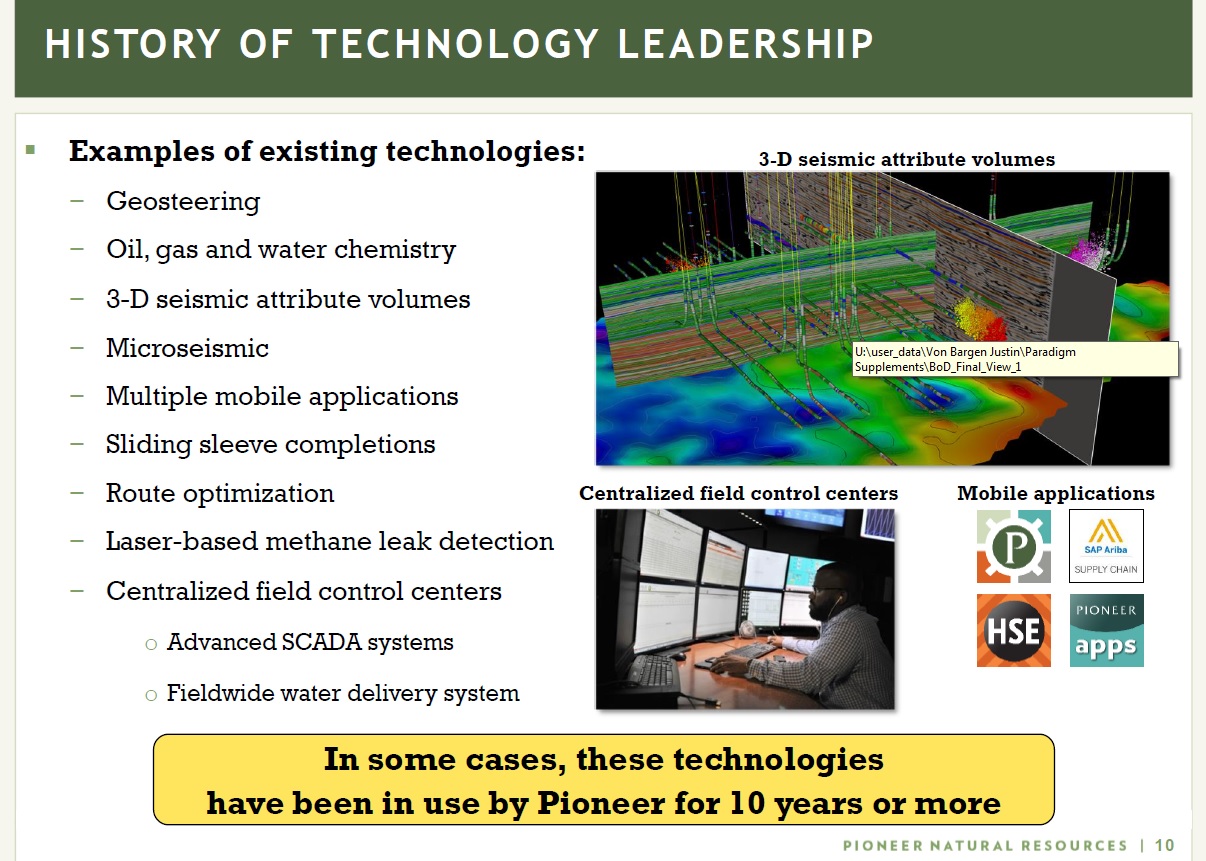
The success of shale drilling is due in no small part to continued technological innovation. E&P companies such EOG and Pioneer include examples of the impact of IT on their activities. American technological innovation is increasingly what’s driving the Shale Revolution. Below are six slides from earnings presentations to illustrate:
.avia-image-container.av-cgmwko-a5ba7ce9fbb03e929a122e3fc2bec18d img.avia_image{ box-shadow:none; } .avia-image-container.av-cgmwko-a5ba7ce9fbb03e929a122e3fc2bec18d .av-image-caption-overlay-center{ color:#ffffff; }
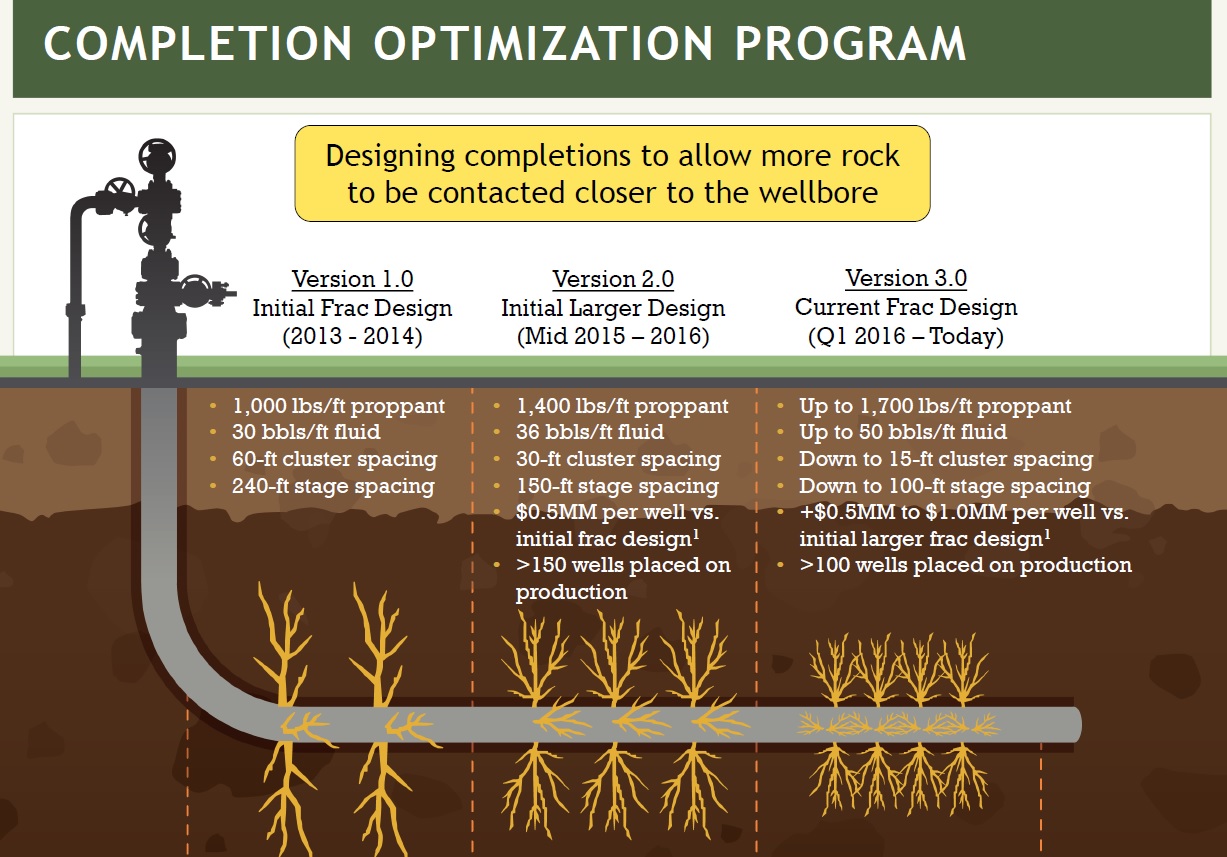
Fracking 3.0 focuses on more targeted areas supported by detailed geological analysis to identify the best spots to drill. It also uses more grades of sand including very fine grains, resulting in greater variety of cracks being propped open as the water/sand mixture ruptures the rock.
.avia-image-container.av-11jiso-85c4ad8ecf467e90f1570ecf2696251c img.avia_image{ box-shadow:none; } .avia-image-container.av-11jiso-85c4ad8ecf467e90f1570ecf2696251c .av-image-caption-overlay-center{ color:#ffffff; }
Often the drill bore used to drill the well is remotely guided by an operator sitting in a control room miles away. Increasing data mining allows for greater precision in drilling the most productive spots.
.avia-image-container.av-8l3jiw-6d39a1b7d246d043e5ee7c21530de036 img.avia_image{ box-shadow:none; } .avia-image-container.av-8l3jiw-6d39a1b7d246d043e5ee7c21530de036 .av-image-caption-overlay-center{ color:#ffffff; }
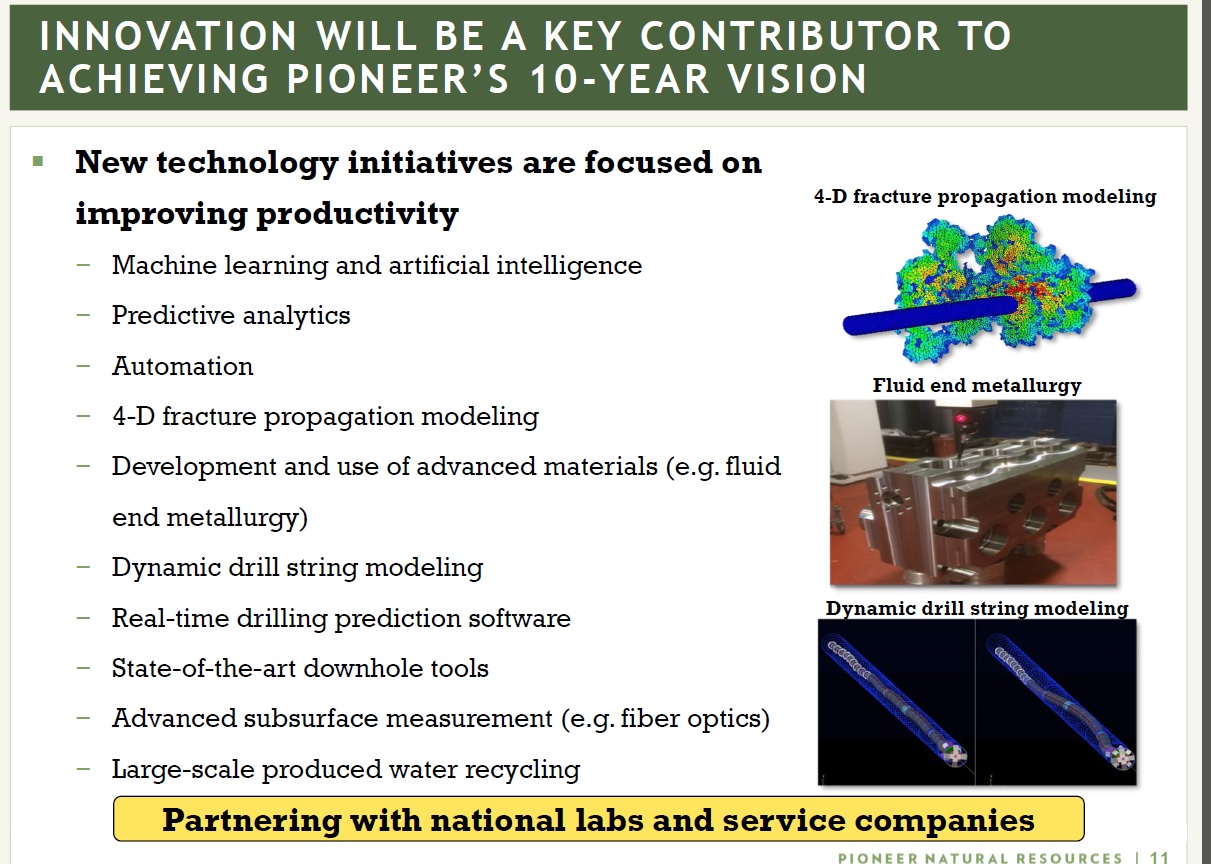
Artificial Intelligence and Predictive Analytics play a role. Often, today’s oil drillers leave their hard hat at the door to sit in front of a computer screen.
.avia-image-container.av-773ruw-b9b96c705537e67346eddfa32fd31fc7 img.avia_image{ box-shadow:none; } .avia-image-container.av-773ruw-b9b96c705537e67346eddfa32fd31fc7 .av-image-caption-overlay-center{ color:#ffffff; }
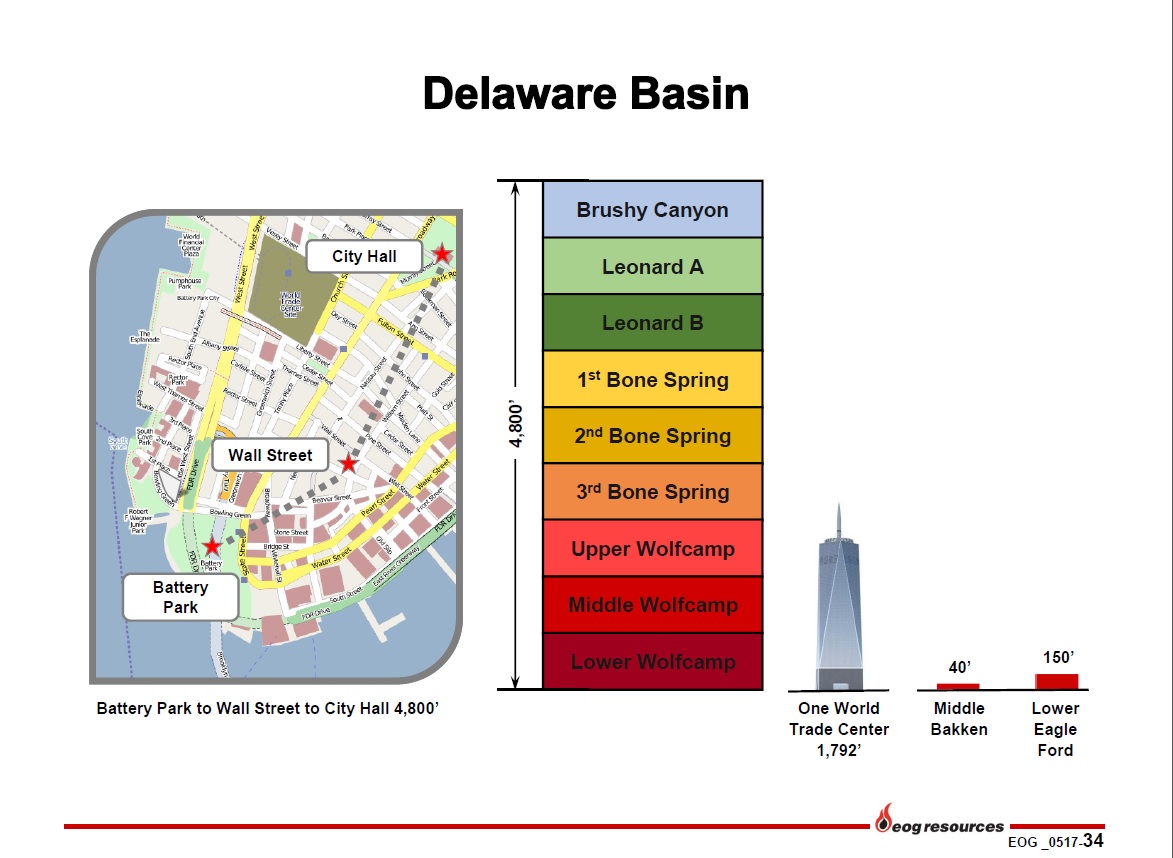
This slide from EOG illustrates the extraordinarily deep layer of exploitable rock formation in the Delaware (Permian) Basin in West Texas, compared with much shallower opportunities in the Eagle Ford (South Texas) and Bakken (North Dakota). They compare the thickness of the Delaware Basin play with the distance from Battery Park in lower Manhattan to City Hall. The Permian makes possible multi-layer drilling which greatly improves the economics. It’s why there is so much interest in the Permian.
.avia-image-container.av-6im7qw-e9510d098b8ecdd44a74f191512c1689 img.avia_image{ box-shadow:none; } .avia-image-container.av-6im7qw-e9510d098b8ecdd44a74f191512c1689 .av-image-caption-overlay-center{ color:#ffffff; }
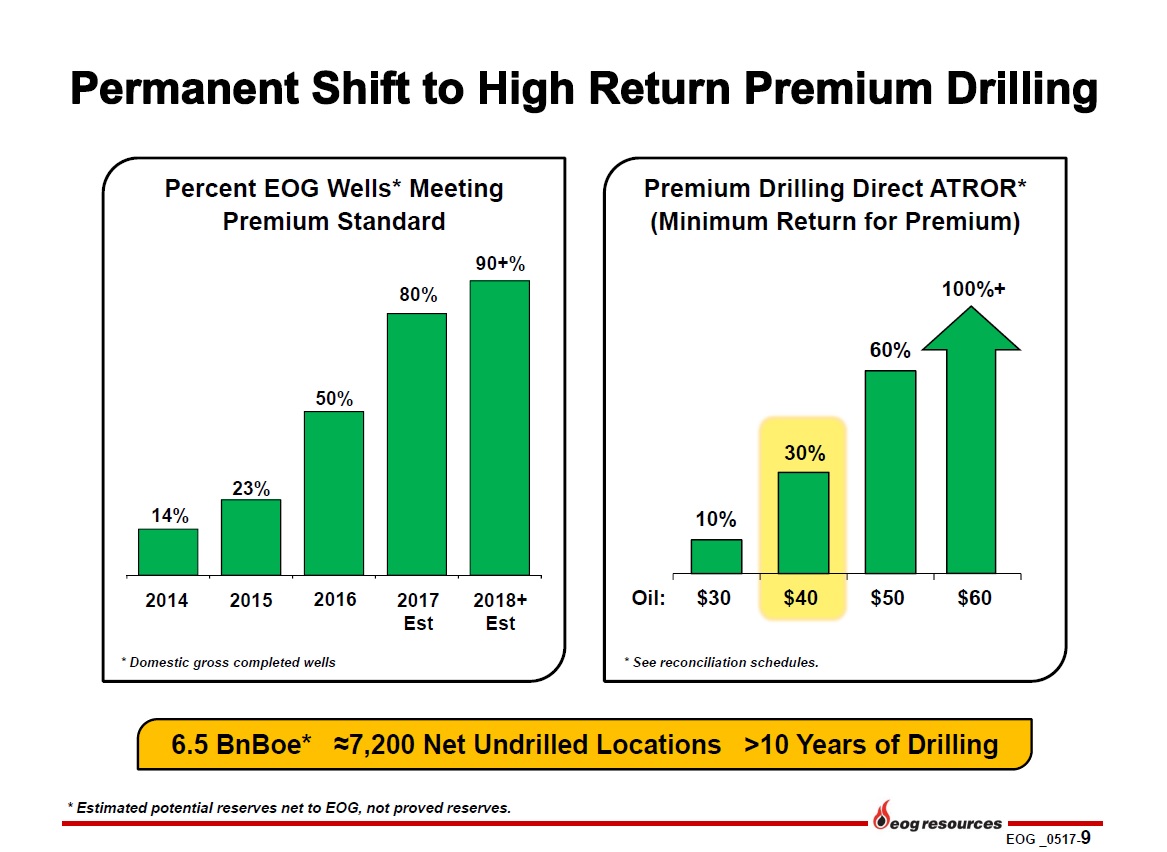
This illustrates how EOG has been able to raise the percentage of its wells defined as “Premium Standard” based on meeting a certain minimum After Tax Rate of Return (ATROR). On their earnings call last week EOG had Sandeep Bhakhri, Chief Information and Technology Officer. Bhakri provided a summary of EOG’s intense use of data to make accurate, fast decisions. EOG is a leader in providing actionable data to front-line personnel which allows them to adapt drilling plans as they receive new information. As he said, “We built 10 web-based self-service applications, eliminating the need for employees to ask each other what questions and to instead focus on why and how questions.”
.avia-image-container.av-3hx3u0-da0295fe99e7b7b0c2b2285bf300e44d img.avia_image{ box-shadow:none; } .avia-image-container.av-3hx3u0-da0295fe99e7b7b0c2b2285bf300e44d .av-image-caption-overlay-center{ color:#ffffff; }
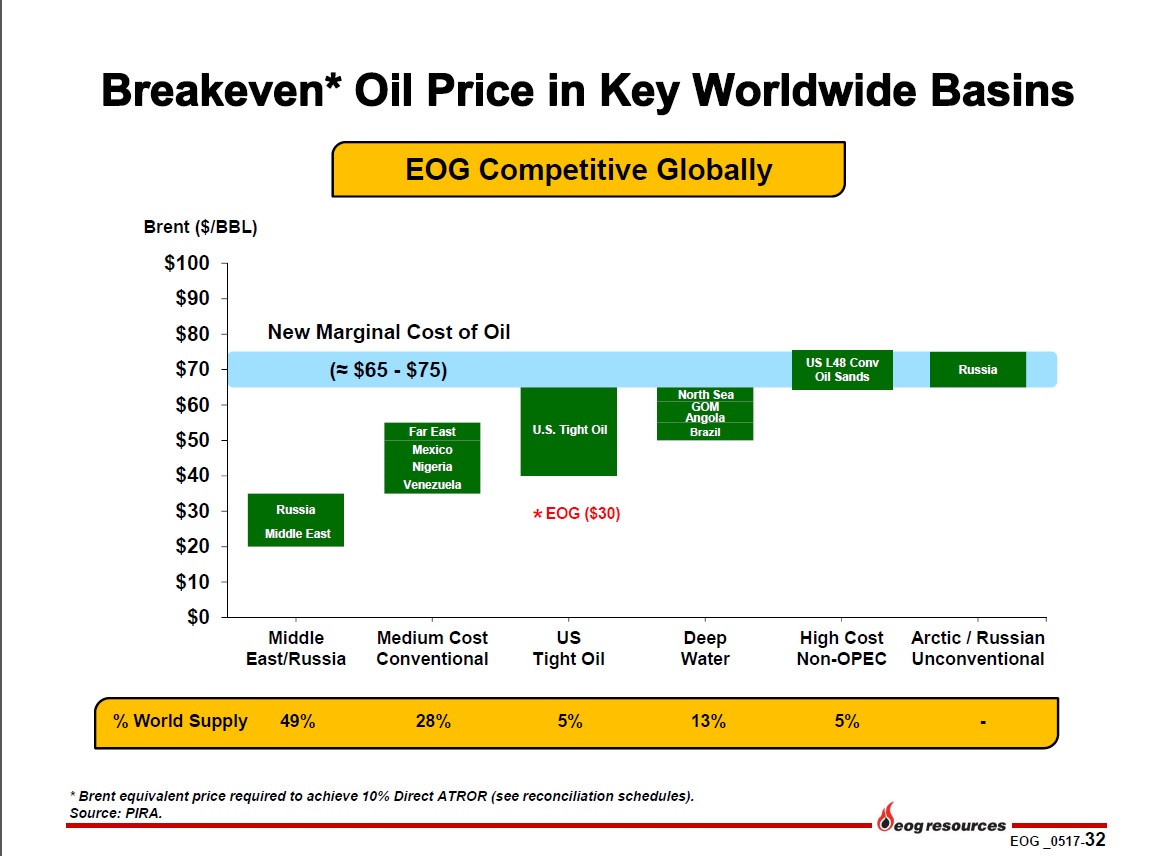
Finally, this slide is EOG’s analysis of the required break-even for various sources of crude supply globally. U.S. shale is the swing producer because its opportunities are short-cycle, able to return capital invested within a matter of quarters. But shale is no longer the marginal producer. Based on this chart, the price of crude oil will eventually need to move higher in order to draw enough supply to meet demand.
E&P companies are the customers of MLPs, so their success is obviously important. Recent earnings reports from E&P companies, as well as the energy infrastructure businesses that are vital in getting their hydrocarbons to market, support growing output. This is confirmed by the U.S. Energy Information Administration, which recently increased its forecast of U.S. crude output to an average of 9.3 MMB/D for 2017 and nearly 10.0 MMB/D in 2018.
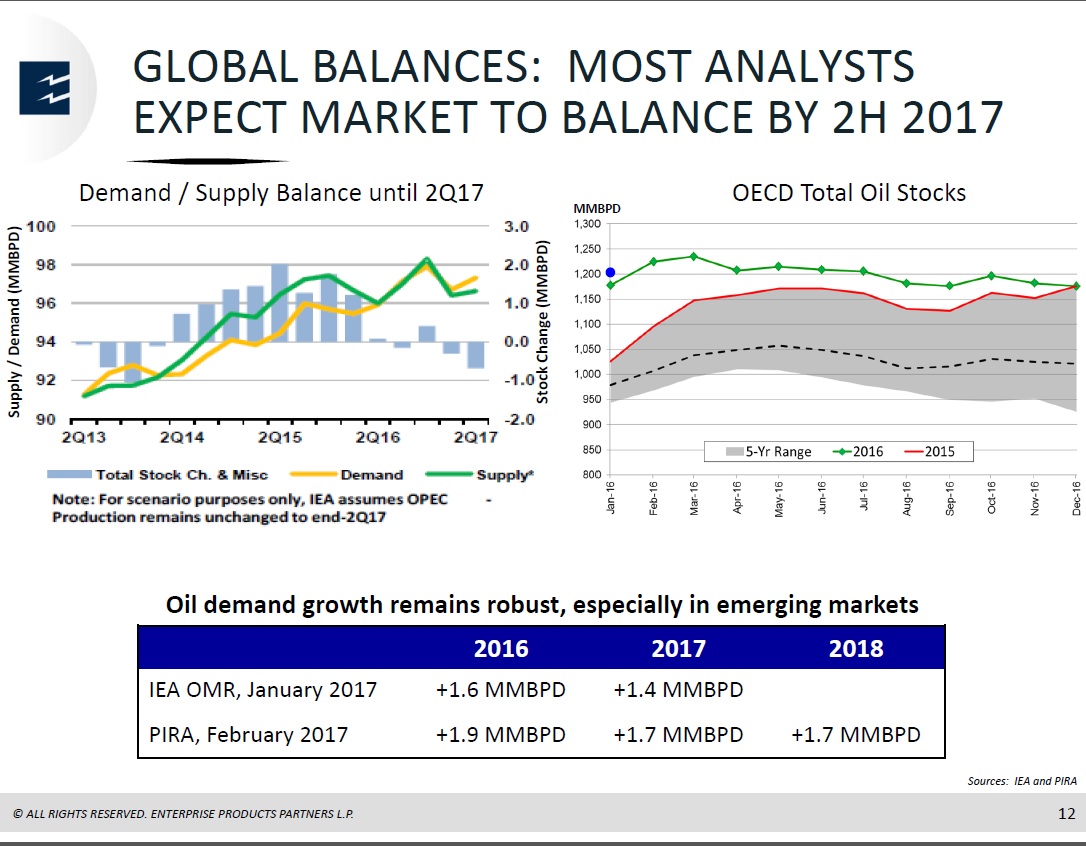
This greater certainty about future supply is reflected in the narrowing dispersion of price forecasts for crude oil (see U.S. Oil Output Continues to Grow). Steadily growing hydrocarbon output is expected by the energy industry and the U.S. Federal government. Even OPEC expects more U.S. oil production; last week they increased their forecast U.S. growth by 285K barrels a day, to 820K. It’s a factor causing OPEC to likely extend last year’s production cuts, which further concedes market share to shale. The only place where growing U.S. output is seemingly not expected is in the stock prices of MLPs, as investors know only too well. The last chart, from midstream business Enterprise Products (EPD), shows that it’s not only U.S. E&P companies expecting the market to balance at current/planned levels of supply.
.avia-image-container.av-1wbf20-969a33381d3f27900de3261ca7f2c5c8 img.avia_image{ box-shadow:none; } .avia-image-container.av-1wbf20-969a33381d3f27900de3261ca7f2c5c8 .av-image-caption-overlay-center{ color:#ffffff; }
The strong correlation between crude and MLPs from 2015 is well remembered by many and is part of the history of every risk model, which probably reinforces today’s connection. But the continued operating efficiencies of U.S. shale drillers are supporting higher levels of production at lower prices than many investors expected. A key difference between 2015 and today is the two year oil spread, which reflects a far more positive view of sustaining domestic production than was the case during the MLP Crash. MLP investors shaken by the recent drop in the sector would do well to consider the information reflected in other markets.
We are invested in EPD