Emerging Markets: Promises Unfulfilled, Time to Upgrade into MLPs
Most MLP investors are attracted by the regular distributions paid out by midstream infrastructure businesses. Some though, are wary of a repeat of the heightened volatility of 2015 even though evidence increasingly supports our analysis from early last year that an improbable confluence of circumstances was responsible (see The 2015 MLP Crash; Why and What’s Next).
I had just this conversation with a financial advisor last week, and I offered him the following perspective: if MLPs are too volatile to be an income substitute, an alternative approach is to consider them as a replacement for equity sectors that have similar volatility and with whom they share a meaningfully positive correlation.
Many advisors recommend an allocation to Emerging Markets (EM). The theory behind this is that because developing countries have faster GDP growth than developed countries, they should offer commensurately higher equity returns. The problem with this theory is that the transmission mechanism from GDP growth to equity returns is not uniformly effective all over the world. Weak corporate governance and property rights, uncertain contract law and government corruption can all interfere with a foreign investor’s GDP insight translating into appreciation of stock holdings.
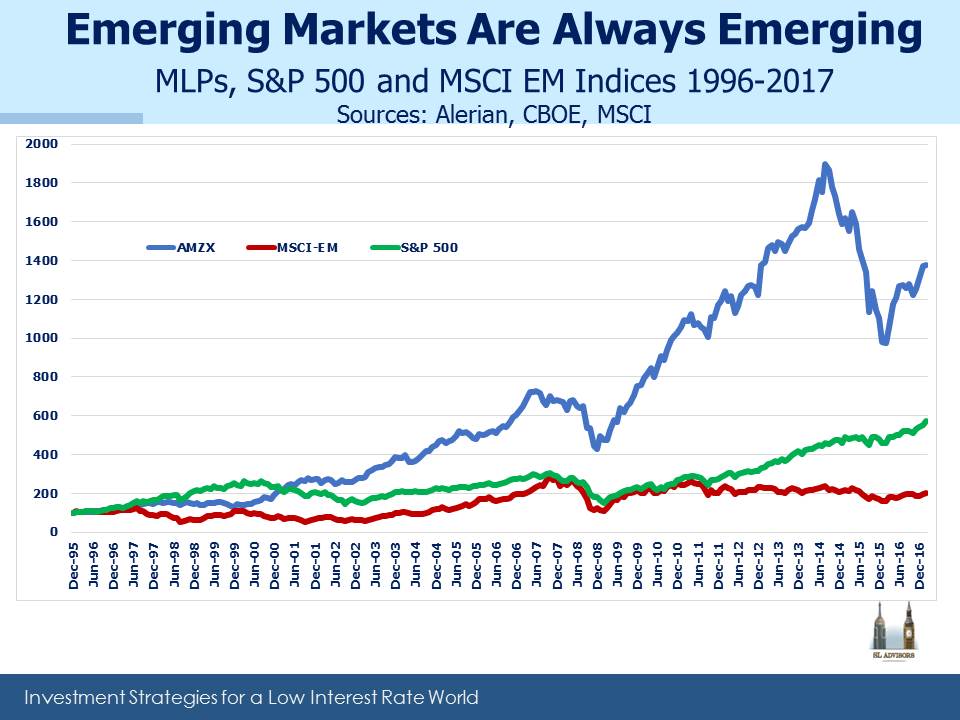
Since 1996 (the inception of the Alerian Index, AMZX) the correlation of monthly returns on the MSCI Emerging Markets Index (MSCI-EM) with AMZX is 0.42. But it’s been rising, and over the past ten years it’s 0.53 and for the past five 0.55.Because the U.S. High Yield bond market is dominated by Energy issuers, when investors flee more risky borrowers their actions tend to ripple across Energy as well as EM. Asset class correlations generally have been rising, diminishing the benefits of some types of diversification. MLPs also have only around 80% of the volatility of EM. Moreover, since 1996 AMZX has returned 13.2% annually, almost four times the MSCI-EM’s 3.4% even though 2015 was a terrible year for the energy sector. Switching out of EM and into MLPs offers just this type of opportunity for a portfolio upgrade that doesn’t increase overall risk.
Some years ago when I was with JPMorgan, I was in India and had the opportunity to chat with a senior member of the Reserve Bank of India (RBI), the country’s central bank and securities market regulator. We had been meeting with Indian hedge fund managers while we considered the wisdom of adding an Indian investment to our portfolio.
“How many insider trading cases does the RBI prosecute in a typical year?” I casually enquired. “Oh none. There is no insider trading in India.” was the barely credible response. To which the only rational conclusion is that if your Indian investment manager isn’t actively using inside information, you’re unlikely to make much money. A JPMorgan due diligence questionnaire that sought an affirmative response on this question would have taken internal meetings with Compliance in a wholly unhelpful direction. We did not invest in India.
Most global companies have revenues and profits linked to EM. They have to allocate capital where they see the best opportunities, and navigate their way through each country’s business practices, laws and taxes to realize an appropriate return. The collective capital allocation decisions of the management of the S&P500 companies is almost certainly far better than that of any EM money manager screening locally listed stocks. If Coca Cola, P&G, Nike, Apple and so on in aggregate seek 3% exposure to Brazil, it takes a substantially mis-directed degree of self-confidence to assume one knows better. Therefore, many investors can hold their large cap equity positions and consider their optimal EM exposure achieved as well.
The S&P500 has generated an annual return of 8.6% since 1996, handily beating the MSCI-EM return of 3.4% noted earlier. In fact, the EM index is still 30% below its high from 2007, before the Financial Crisis. The figures clearly show that the relatively faster GDP growth of Developing Economies doesn’t translate into higher equity returns. Those investors seeking direct exposure are getting severely penalized.
Given the history and figures listed above, switching EM into MLPs is pretty compelling. The lower volatility of MLPs combined with their increasing correlation with EM means that the switch is likely to improve your portfolio’s risk characteristics. More importantly, it should substantially improve your return profile. MLPs regularly beat EM; since 1996, the one year trailing return on MLPs has beaten EM by at least 10% fully 48% of the time (the reverse statistic is only 24%). By contrast with EM, your domestic energy infrastructure investment benefits from attractive valuation, the tailwinds of America’s path to Energy Independence and a White House that is clearly supportive. Disputes over trade, a strengthening dollar or the overthrow of a foreign potentate are all challenges for the EM manager that will leave the MLP investor blissfully unharmed.
So if you’d like to participate in the secular growth in U.S. energy infrastructure that is driven by the Shale Revolution but are wary of classifying it as an income generating investment, use your EM bucket and improve your overall portfolio quality. If the K-1s put you off, look for a RIC-compliant mutual fund that provides 1099s.