Oil and Gas Output to Reach Records Next Year

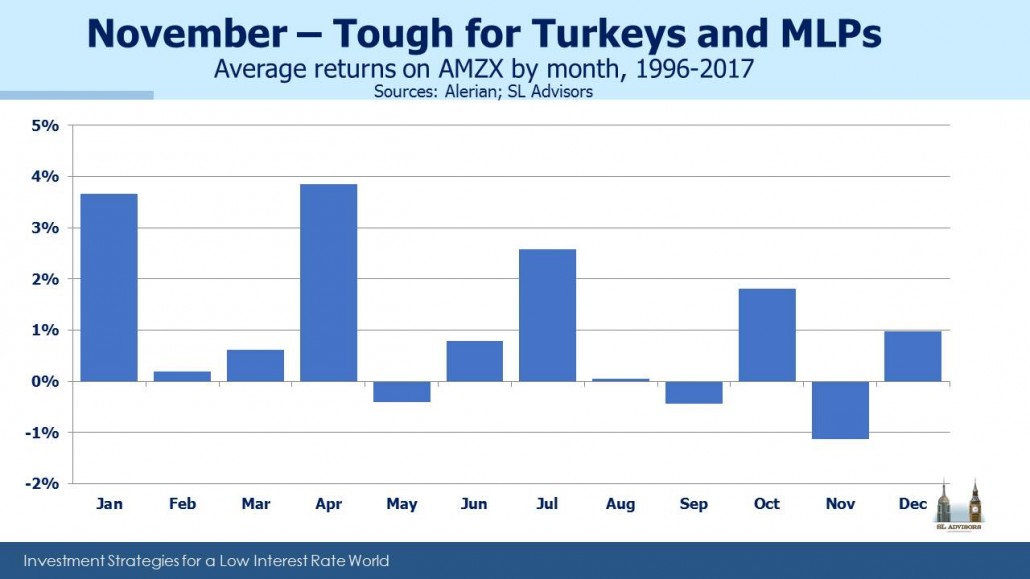
Seasonal patterns can be interesting when there’s some plausible substance driving the relationship. For several years we’ve noted the persistence of November to be weak, with the best returns occurring early in the calendar year (see Why MLPs Make a Great Christmas Present). The predominance of individual investors (rather than institutions) in the sector accounts for much of this. Most of us probably take stock of our investments around year-end, perhaps enjoying a welcome break from overindulgence at the dinner table. Any resulting portfolio shifts therefore take place shortly after.

K-1s are another factor; if you’re thinking of selling a publicly traded partnership, why wait until January when you’ll receive another K-1 for the partial year. Similarly, if you’re contemplating buying, you might as well delay until January so as to avoid a K-1 for the last part of the year. In both cases this leads to more sellers than buyers late in the year and the reverse in January.

.avia-image-container.av-45lj6e-3b37ecf90152ce95d9fec44fd6033c19 img.avia_image{ box-shadow:none; } .avia-image-container.av-45lj6e-3b37ecf90152ce95d9fec44fd6033c19 .av-image-caption-overlay-center{ color:#ffffff; }

Every year there are reasons to suppose that the seasonals won’t work. We’ve written many times that MLPs have lost the support of their traditional investor base, and that energy infrastructure corporations (“C-corps) are now as big as MLPs (see The American Energy Independence Index). So that may dilute the impact of individual tax-driven decisions over time. Anecdotally though, there has certainly been some individual tax-loss selling recently. Returns ex-energy have been strong, and some investors are booking losses in MLPs to offset other taxable gains.

But it’s also true that those not invested in energy infrastructure are far more numerous than those who are. As despondent as today’s investors may be, we have regular conversations with others with capital to commit who see potential opportunity in attractive valuations and the beaten down sentiment of existing holders.

.avia-image-container.av-2x3dpi-d8790b797cb9d8ddaae0f7479fe53e6d img.avia_image{ box-shadow:none; } .avia-image-container.av-2x3dpi-d8790b797cb9d8ddaae0f7479fe53e6d .av-image-caption-overlay-center{ color:#ffffff; }

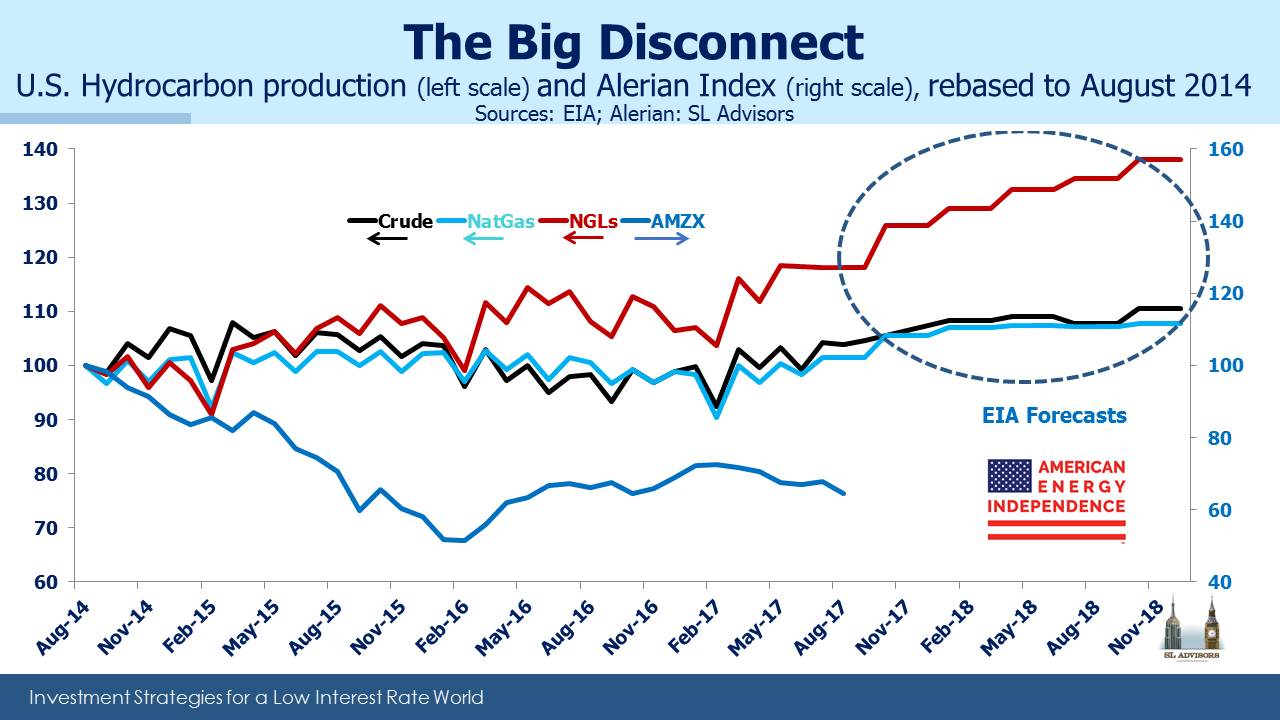
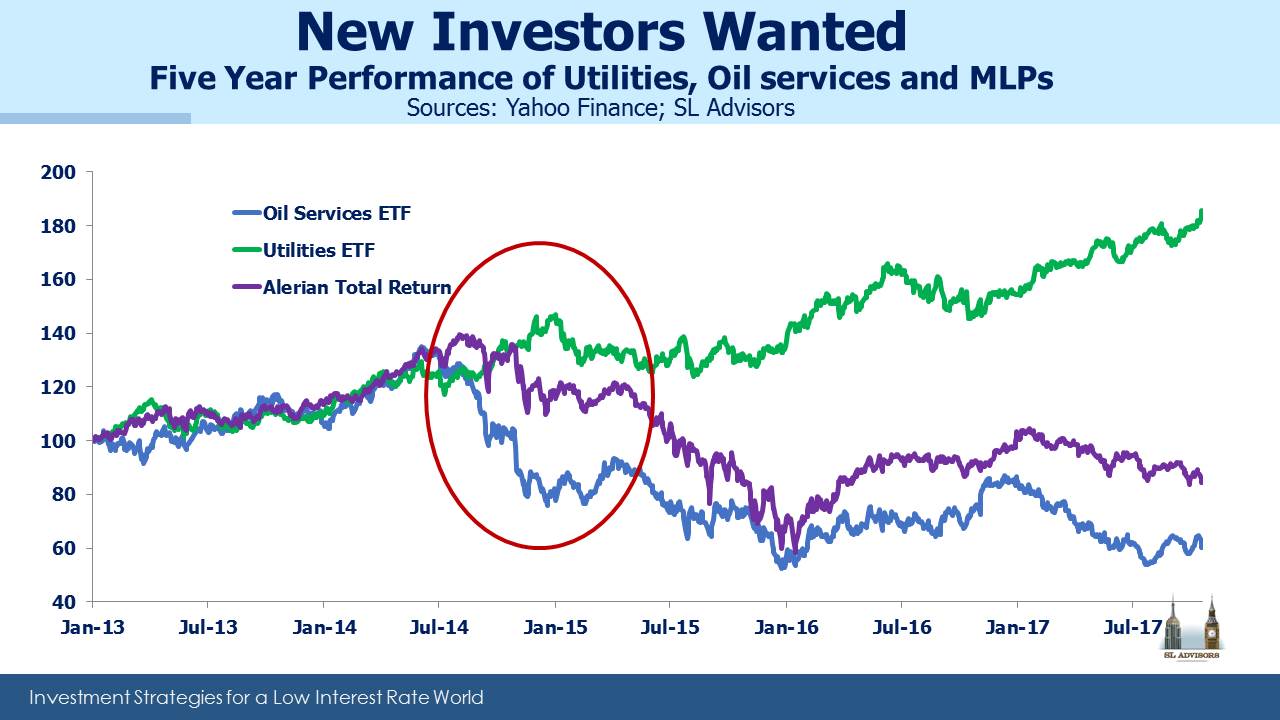
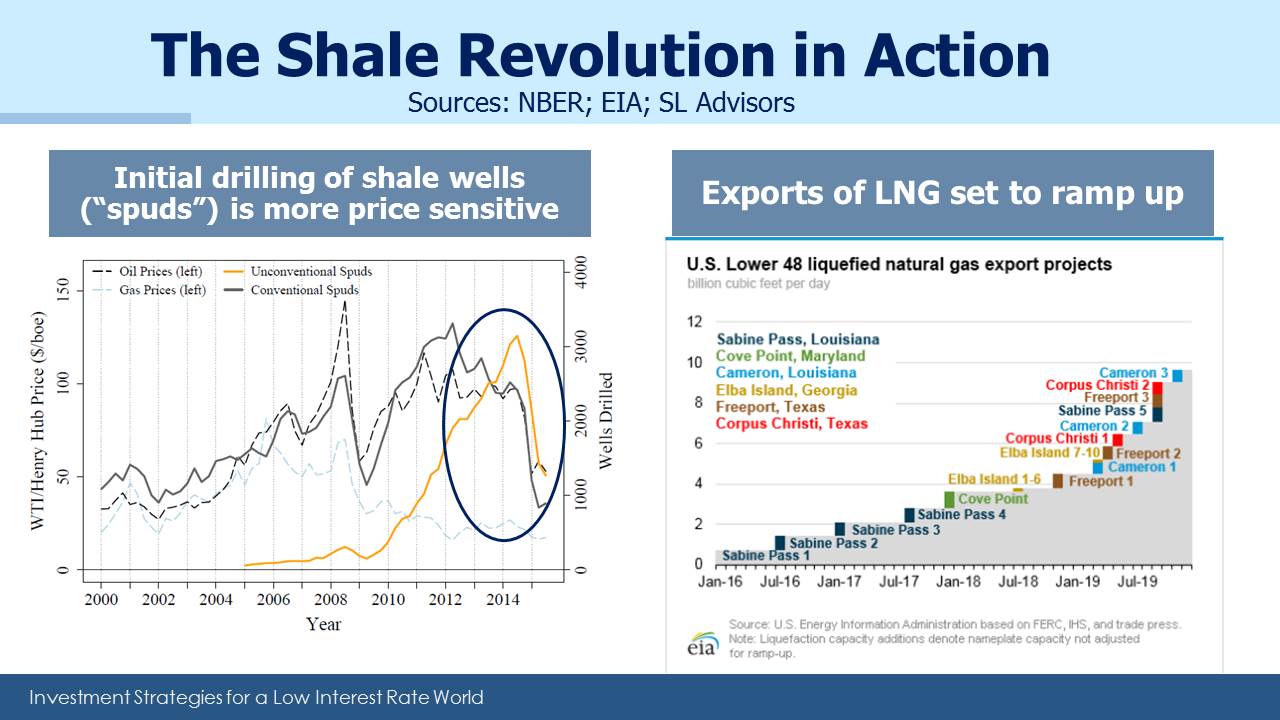
The second chart captures the common refrain of investors frustrated by growing U.S. hydrocarbon production that so far hasn’t raised stock prices for the energy infrastructure businesses that support it. They’re right. Since the August 2014 peak in the sector, production levels have recovered and are now higher than they were three years ago. A recent report from the Energy Information Administration (EIA) forecasts record output next year in crude oil, natural gas and Natural Gas Liquids (NGLs). The Alerian Index has disconnected from this volume growth, in part because traditional investors were alienated by the distribution cuts to fund growth and reduce leverage that many businesses undertook (see Why the Shale Revolution Hasn’t Yet Helped MLPs). But the volumes are certainly coming. Today’s investors are getting paid with attractive distributions to wait for new investors to respond to the opportunity. The seasonal pattern may yet provide the catalyst.

On a different note, long-time readers will be aware of our disparaging comments about non-traded REITs, a nasty little security with no legitimate place in a retail investor’s portfolio because of the exorbitant fees charged (up to 15% of an investor’s money). Three years ago in one warning blog about the sector, we referenced American Realty Capital Properties founded by Nick Schorsch (see A Scandal That Should Shock Nobody). Former CFO Brian Block was recently sentenced to 18 months in prison for six counts of fraud. If your advisor recommends non-traded REITs, it may be because they’re more in his interests than yours.


Why the Shale Revolution Hasn't Yet Helped MLPs

MLP investors must wish they’d never heard of the Shale Revolution. The consequent growth in volumes of crude oil and natural gas seemed a fairly simple thesis for owners of volume-driven infrastructure assets. Increased demand for pipeline and storage capacity, for gathering and processing networks, ought to be good for the sector. But so far, a dramatically more productive domestic energy industry has driven MLP stock prices relentlessly lower. Moreover, the divergence between the energy sector and the broader averages is a common investor complaint  – the truism that MLPs are a volume business and therefore rising volumes should be good isn’t reflected in recent returns.

Early last week the International Energy Agency (IEA) published World Energy Outlook 2017 which forecasts that the U.S. will become the world’s biggest Liquified Natural Gas (LNG) exporter by the mid-2020s, and a net oil exporter by the end of that decade. Other long term forecasts, including those from the Energy Information Administration, Exxon Mobil and Goldman Sachs are broadly consistent with the IEA. MLPs slumped anyway, perhaps oblivious to the report or maybe because of it.

The Shale Revolution, the paradigm driving America to Energy Independence, has not done much for investors. It’s pressured cashflows and balance sheets of formerly stable businesses. Few management teams seem able to pass up growth opportunities, and the consequent redirection of Distributable Cash Flow (DCF) from distributions to growth projects has alienated those wealthy Americans who accepted K-1s in exchange for steady, growing, tax-deferred income. The evidence of this is most clearly seen in the defiantly high yields of some securities. Energy Transfer Partners (ETP), with its 14% payout, reflects investor disbelief that payments will continue.

Since yield no longer convinces, consider Duke Energy Corp (DUK) which delivers electricity and natural gas to over 9 million customers across the southern and Midwest U.S. It operates a highly regulated, capital intensive business.  Kinder Morgan (KMI) transports, treats and stores natural gas (including now LNG), natural gas liquids and crude oil in a highly regulated, capital intensive business. Debt:Equity at DUK is 5.6X and KMI is 5.3X, so they’re similarly leveraged. But KMI’s multiple to its Distributable Cash Flow (DCF, or Free Cash Flow less growth capex) is 8.8X. The analogous cash flow multiple for DUK is 13.2X (Net Income plus D&A minus maintenance CapEx). DUK is 50% more expensive on a cash flow per share basis.  Furthermore, the value of the land and easements acquired for pipelines appreciates over time whereas power plants eventually depreciate to zero. In this regard, DUK’s $7B/year (11% of it’s market cap) in growth CapEx becomes much more concerning.

.avia-image-container.av-2ig47l-77edbb88bfc35e7f22038387df0dcef0 img.avia_image{ box-shadow:none; } .avia-image-container.av-2ig47l-77edbb88bfc35e7f22038387df0dcef0 .av-image-caption-overlay-center{ color:#ffffff; }

The Utilities sector has been strong this year, which has stretched valuations while energy, including infrastructure, has lagged. The question is why investors in DUK and other similar names don’t make what looks like a substantial valuation upgrade by switching from one highly regulated business to another. KMI long ago broke its contract with the original Kinder Morgan Partners investors. When you remove a slide titled “Promised Made, Promises Kept” (see What Kinder Morgan Tells Us About MLPs) there are consequences. Redirecting cashflow from distributions to growth projects necessitated the revision to its investor presentation and took them in search of new investors.

MLPs are a shrinking part of the energy infrastructure landscape. The Shale Revolution is leading us towards Energy Independence, increasingly through C-corps (hence our new American Energy Independence Index). But the sector moves nowadays with the Oil Services sector whose biggest names are struggling with a global slump in spending on conventional oil and gas projects, whereas in the U.S. the strength in volumes and spending continues. The close relationship between oil services and energy infrastructure is not likely to sustain over the long term given their substantially different business models (cyclical versus regulated; global versus domestic).

Recent weakness may also be due to concerns that tax reform could result in lower corporate tax rates with no improvement in rates charged on passive investment income from pass-through vehicles. This would benefit C-corps over MLPs — although details on the plan continue to change, there’s probably less certainty about the ultimate tax treatment for MLPs which could be causing potential buyers to wait for clarity. The news that Norway’s $1TN sovereign wealth fund is planning to divest its oil and gas holdings certainly didn’t help sentiment either.

Returning to the chart, it shows that as growth plans took hold through 2014-15, increasing secondary offerings (how you finance growth if you pay out all your cashflow in distributions) revealed the reluctance of traditional MLP investors to reinvest those payouts. This drove yields up and hurt sector performance. Although they got there in different ways, most big MLPs concluded that the growth capital wasn’t available and so cut payouts, redirecting cash to fund projects instead. Traditional MLP investors felt betrayed and are clearly not rushing to invest in the sector, which has created today’s value opportunity.


Energy Production Supports MLP Outlook

U.S. energy production continues to grow, boosting exports and continuing our path towards Energy Independence. The most recent weekly production figures from the Energy Information Administration (EIA) show U.S. crude output reaching 9.62MMB/D (Millions of Barrels per Day) exceeding the previous recent peak in June 2015. Production has fully recovered from the dip following Hurricane Harvey.  The EIA projects that we’re on track to reach a daily average of 9.9MMB/D next year. This will eclipse the prior record of 9.6MMB/D set in 1970. Until the Shale Revolution few thought we’d ever see that figure again as crude output began a 40-year decline.

Natural gas production is expected to average 73.4 BCF/D (Billion Cubic Feet per Day) this year, up 0.6 BCF/D from 2016. Next year should see a big leap to almost 79 BCF/D. As we noted last week (see The U.S. Lowers Oil Volatility), exports of Liquified Natural Gas are set to more than quadruple over the next three years.

Electricity generation from renewables is also growing. Ex-hydro power, renewables will increase their share of generation from 8% this year to 10% by 2019. Since it’s not always sunny and windy, this growth in renewables is often supported by baseload power from natural gas plants that can vary output as needed. Natural gas and renewables have a symbiotic relationship.

A financial advisor asked me the other day what variables he should watch most closely as near-term drivers of MLP performance. As current investors know too well, crude oil sometimes moves the sector (as was the case in the first half of the year) but sometimes doesn’t (the case since June). The fundamental link between the two is tenuous — volume growth must surely be a more important driver of returns, since the financial link with cash flows is there.

The security of our domestic energy supplies is in marked contrast to other parts of the world. Saudi Arabia (10 MMB/D) is tackling widespread corruption with dozens of arrests of princes. Iraq (4.35) is grappling with Kurdistan’s increasing independence. Iran (3.78) is engaged in a proxy war with Saudi Arabia via Yemen. Venezuela (1.95) is close to economic collapse. The list goes on. The President wants “Energy Dominance”, which sounds even better than energy independence if you’re invested in domestic energy assets.

Last week Bloomberg broadcast a really terrific 45-minute documentary on The Next Shale Revolution. It’s absolutely worth watching.

The American Energy Independence Total Return Index is now updated daily by S&P Dow Jones Indices.

MLPs have been reporting earnings which have generally been in-line. Sentiment and valuations remain depressed, but the shorts have found little ammunition in recent conference calls. Yields are attractive and in some cases defiantly high. Energy Transfer Partners (ETP) yields 13%, while its General Partner (GP) Energy Transfer Equity (ETE) yields half that. ETP results were in line with expectations but guided to higher growth capex next year than some were expecting– clearly, few investors expect ETP’s 13% yield to persist, in spite of the recent hike in payout and a promise to evaluate further hikes in the future. An acquisition of ETP assets in exchange for new ETE units would be a stealth distribution cut for ETP, but lacks repricing up of ETP assets to create a bigger depreciation charge since ETE is not a c-corp (they could create a c-corp first — if they do, a subsequent combination is likely). ETE CEO Kelcy Warren remains a deterrent for many potential ETE buyers given his history of self-dealing (see Is Energy Transfer Quietly Fleecing Its Investors?). In any event, ETP is unlikely to yield 13% a year from now. And it’s worth noting that when asked if there was any likelihood of ETE/ETP consolidation within the next two years, Kelcy Warren simply answered, “No”.

NuStar (NS) also yields over 13% and its GP NuStar GP Holdings (NSH) offers over 12%. Market skepticism oozes over both names, caused most notably by NS’s decision earlier this year to acquire crude oil gathering and processing assets (Navigator) in the Permian for almost $1.5BN. NS’s distribution is not covered by Distributable Cash Flow (DCF) and 1.0X coverage remains over a year away. Merging the two would improve things because the NSH distribution is fully covered by DCF. It would bring Debt/EBITDA down from 6.1X to 5.3X, still above the 4-5X generally targeted by MLPs. However, it would also cede the optionality inherent in the GP/MLP structure. NSH seems to appreciate this better than most, since the Navigator acquisition was funded by NS with a temporary waiver of IDRs to NSH. To apply our hedge fund analogy, the hedge fund (i.e. NS) issued debt and equity at the direction of its hedge fund manager (NSH) which ultimately creates increased cashflows to NSH. Another alternative is for NS to issue equity to NSH who would issue debt to finance it (NSH has almost no debt). They have a lot of levers to pull.

Nonetheless, NuStar’s consolidated debt is $3.7BN, and the Navigator assets cost $1.5BN. It’s another example of an MLP seeking growth funded by debt when its traditional, yield-seeking investors just want stability with no excitement. Wealthy, older K-1 tolerant American investors don’t find the Shale Revolution’s need for new infrastructure nearly as exciting as the management teams.

Hence you have this monologue from President and CEO Brad Barron, in response to a question about distribution coverage: “…I would have never dreamed past year and a half close to 20 MLPs that have either restructured or reset or cut their distribution in some way. …how do you value MLP, is it a dividend discount model, with (sic) the enterprise to EBITDA model. So what I think would be most helpful is for the space to in terms of the normalcies with the equity markets begin acting rational again. … the value of NuStar has not being recognized appropriately …we’re managing this business for the long term.” In fact, one analyst counts 56 MLP distribution cuts since 2014.

Since distribution cuts are no longer rare, UBS’s Shneur Gershuni asked NS why they don’t cut theirs by $200MM annually (in 3Q17 the distribution was $34MM in excess of DCF). This is why the yield is high. NS investors are clearly not scrambling to reinvest their distributions back into NS, even though management rates the opportunity highly and Chairman William Greehey regularly adds to his holdings of NS and NSH.  We appreciate Greehey’s perspective even if the market is skeptical. The admission by NS Treasurer Chris Russell that Navigator’s 3Q EBITDA was only $12MM didn’t help. But by 2020 NS expects Navigator to be generating $250MM of EBITDA. Until then, management forecasts a net cash outlay of around $100MM (EBITDA that is ramping up less debt expense and approximately $350MM in capex). That will leave NS having invested around $600MM in equity ($500MM at acquisition plus the $100MM since then),  supported with $1BN in debt. By 2020 they’ll own an asset valued at roughly 6-7X EBITDA (i.e. $1.6BN cost divided by $250MM), with Debt:EBITDA leverage of 4X. It’s the outlook of a private company whereas NS is public, and three years is a very long time for equity traders. But we see the logic in the transaction.

Investors are increasingly rejecting using dividends to value MLPs, because (as Barron notes) so many have cut dividends. The industry could have opted for more modest growth, but levered up instead, and can’t figure out why their dividends draw so little respect. We think NuStar’s leverage metrics will improve and it’ll all work out, but it’s been a challenging run for traditional MLP investors.

We are invested in ETE and NSH


The U.S. Lowers Oil Volatility

MLP investors are well aware that energy infrastructure securities move with crude oil, until that relationship inconveniently broke down during the Summer. Although we move and process far more natural gas (on an energy equivalent basis) than oil, investor sentiment causes the link. Because the economic link is weaker than sometimes implied by moves in the sector, the two can part company with little warning.

Some relationship makes sense, because pipelines and related infrastructure are typically built in anticipation of future demand. Commencing pipeline operations at 100% capacity is of course the best case, but more common is a steady ramp-up of utilization. The rate at which capacity gets used up can depend on production levels in the supplying region, and production is sensitive to price.

Before the Shale Revolution, U.S. crude oil production was heading steadily lower. Today, any forecast of U.S. output must be based in part on commodity prices. The correlation between the two is sometimes higher than it should be, but it’s no longer a commodity-insensitive business.

A recent report from the National Bureau of Economic Research (The Unconventional Oil Supply Boom: Aggregate Price Response From MicroData) seeks to measure the sensitivity of U.S. oil production to price. Among their conclusions is that unconventional drilling is up to six times more responsive to prices than conventional. This is because shale projects are “short-cycle”; the payback time is far shorter. Shale drillers can hedge enough of their expected output to ensure an adequate return, not just because upfront expenses are comparatively low but also because initial production rates are high, relative to conventional wells (see Why Shale Upends Conventional Thinking). Exxon Mobil’s CEO Darren Woods commented earlier this year that a third of their capex budget was dedicated to short-cycle opportunities. It’s because they’re less risky. Conventional projects have far longer payback periods, exposing them to the vicissitudes of prices.

The growing importance of short-cycle projects has a couple of other implications for crude oil. One is that it should reduce market volatility. The greater responsiveness to price of shale production means that supply/demand imbalances are more smoothly corrected. NBER doesn’t go as far as to classify the U.S. as the swing producer (which they define as one able to react within 30-90 days), because such adjustments still take several months. But we clearly have a more sensitive supply response function than in the past. Oil prices are becoming less volatile, as we suggested might happen (see U.S. Oil Output Continues to Grow).

NBER’s conclusions include an additional insight, which is that production from unconventional wells is less variable. Not only do you get your capital investment returned more quickly, but you have greater certainty around output. In combination, these two aspects of shale should lead to lower required returns on capital. All of this is to the enormous benefit of the U.S., since shale drilling is almost exclusively an American phenomenon.

Crude prices have been rising as OPEC’s production curbs gradually take effect. Their decisions will continue to significantly impact prices. But another consequence of shale could be gradually rising prices. NBER estimates that a rise to $80 a barrel would stimulate an additional 2 million barrels a day (MMB/D) of U.S. production within two years. Investing in conventional oil and gas projects has been falling, and it’s generally accepted that we need to produce an additional 4-5 MMB/D annually to offset depletion of existing fields as well as meet new demand. U.S. shale may be part of the solution but the figures above show that other sources will need to provide the lion’s share. Earlier this year Goldman Sachs forecast that at $75 a barrel U.S. production would exceed 20 MMB/D. Cleatly there’s enormous variations in forecasts, and NBER may be overly conservative.

.avia-image-container.av-2mev0t-b25337aa4b9730289ee5db847df668ea img.avia_image{ box-shadow:none; } .avia-image-container.av-2mev0t-b25337aa4b9730289ee5db847df668ea .av-image-caption-overlay-center{ color:#ffffff; }

Therefore, gently rising crude oil prices are the most likely outcome. This can only be good for U.S. energy infrastructure. Meanwhile, Liquified Natural Gas exports are set to increase sharply. The constructive analysis on crude oil prices doesn’t apply as readily to natural gas, because global LNG trade volumes are benefiting from several new sources of supply. But as one of the lowest cost producers, the U.S. is in good shape here as well.


The GOP House Tax Bill Implications

Yesterday we received the first details on tax reform as the House Republicans unveiled their plan. To residents of high-tax states (including your blogger in NJ) it looks like the Republican Tax Hike Plan. Putting aside the impact on some individuals, our thoughts on the investment consequences are as follows:

MLP investors should benefit, because the structure is untouched and we interpret the plan as allowing the 25% business owner pass-through rate to apply to taxable income, rather than ordinary income tax rates. This is more valuable the higher your income. Around 80% of MLP distributions are tax-deferred, and many long-time MLP holders are familiar with receiving a large tax bill when they sell, since taxes on distributions that were deferred are owed at that point. Former Kinder Morgan Partners (KMP) investors are acutely aware of the unwelcome tax bill they received back in 2014 when Kinder Morgan Inc (KMI) acquired KMP’s assets, simplifying their corporate structure but triggering the above mentioned tax event. Under the House proposal, if that was to happen in 2018 the KMP tax bill would be based on the 25% pass-through rate. This will be a consideration for those MLP businesses considering simplification transactions in which the GP buys the MLP, since the acquiring GP won’t have to offer as much consideration to the MLP holders given the likely reduced tax burden.

We didn’t see anything else that was negative for MLPs, notwithstanding the weakness in the sector following release of the plan.

The other items related to corporate taxes affect most corporations, not just those in energy infrastructure. The lower tax rate is obviously good – how good depends on your tax rate. Energy infrastructure businesses generally pay a lower rate than 35% because they have substantial non-cash depreciation charges. By contract, companies in the Consumer Staples sector (which figures prominently in our Low Vol strategies) are generally paying corporate taxes at close to the 35% rate. Those taxed at higher rates will obviously benefit more from a new, lower 20% corporate rate.

Interest expense is capped at 30% of EBITDA (Earnings Before Interest, Taxes, Depreciation and Amortization). So a company with $1MM of EBITDA could deduct up to $300K of interest expense. Assuming they were borrowing at 5%, this would allow them to borrow up to $6MM (i.e. 5% interest on $6MM is $300K) and still deduct the expense. A Debt:EBITDA leverage ratio of 6:1, as in this example, is higher than most energy infrastructure businesses, where 4X-5X is more typical and is coming down. Clearly, if rates were higher this would reduce the amount of tax-deductible debt. A 10% cost of borrowing would impose a 3X Debt:EBITDA tax-deductible leverage limit – probably not a bad idea at such high rates anyway. Faster depreciation schedules may further reduce taxes for some companies, and energy infrastructure businesses are likely beneficiaries.

In April we offered our thoughts on proposed tax reform (see MLPs and Tax Reform). Below is an updated table comparing the impact on energy infrastructure C-corps and MLPs. Tax reform is beneficial to both classes of investment.

.avia-image-container.av-35gy3t-9eeea3284de5d2b35475d9e535324aab img.avia_image{ box-shadow:none; } .avia-image-container.av-35gy3t-9eeea3284de5d2b35475d9e535324aab .av-image-caption-overlay-center{ color:#ffffff; }

The lower corporate tax rate on its own reduces the tax advantage of MLPs versus C-corps. But the pass-through 25% tax rate on distributions when taxable is an improvement for investors. So we don’t see anything here that renders the MLP structure less attractive. C-corps in the energy sector today aren’t anywhere near the 35% rate. Since taxes on investment income (qualified dividends and capital gains) aren’t changing, a lightly taxed C-corp might be less tax-efficient (since its dividends are taxable) than an MLP where the investor can benefit more than the corporation from the tax-deductible depreciation. In short, MLPs can still be advantageous.

The main problem for the structure this year has been an evident unwillingness of traditional MLP investors to provide growth capital (see The Changing MLP Investor and More on the Changing MLP Investor). Maybe the more attractive tax treatment to investors will help.

We are invested in KMI


The American Energy Independence Index

The U.S. energy sector has undergone dramatic changes over the past five years. Hydraulic fracturing (“fracking”) and horizontal drilling have roiled global energy markets. America has shifted from planning to import Liquefied Natural Gas (LNG) to exporting it, with LNG exports expected to more than quadruple over the next three years. Cheap domestic methane has made natural gas the biggest single source of electricity in the U.S., in the process supplanting coal and unexpectedly helping reduce CO2 emissions. Increasing production of Natural Gas Liquids (NGLs) such as ethane are behind close to $200BN of investments in new petrochemical facilities. Propane exports are up five-fold in five years.

In late 2016 OPEC was forced to abandon its strategy of trying to bankrupt U.S. shale oil producers with low prices, because production fell less than needed and many OPEC countries faced gaping budget holes with little to show for it (see OPEC Blinks). Almost 40% of the world’s oil producing nations had tried and failed to kill off the Shale Revolution. American free enterprise triumphed.

The dramatic increase in hydrocarbon production represents one of the greatest examples in recent years of the power of American private sector capitalism. Technological ingenuity and constantly improving productivity allowed costs of production to keep falling. The world’s biggest capital markets provided funding to support a culture of entrepreneurialism and new business formation. Highly developed energy infrastructure networks and a skilled energy labor force were already in place, and other natural resources such as water were conveniently available. Lastly, privately owned mineral rights, a global rarity, allowed individual landowners to profit from the Shale Revolution by signing drilling leases with energy companies. In short, the Shale Revolution leveraged all that’s great about America’s form of capitalism (see America Is Great!).

The changes have been so dramatic that they’re leading us to American Energy Independence. Among the many changes are the positioning of the energy infrastructure business. For years, pipelines were synonymous with reliably stable cashflows that grew modestly and required minimal reinvestment. An entire class of investment, Master Limited Partnerships (MLPs), evolved to provide tax-advantaged exposure for those willing to handle K-1s at tax time rather than 1099s. Over $50BN was raised for deeply flawed mutual funds and ETFs that provide 1099-type MLP exposure while incurring a heavy additional tax burden (see Some MLP Investors Get Taxed Twice).

Energy infrastructure is key to American Energy Independence. Steadily increasing volumes of hydrocarbons are leading to increased investment in infrastructure. Traditional sources of crude oil, such as the Permian in West Texas, are producing more than ever even after almost a century of output. More recent discoveries such as the Marcellus Shale in Pennsylvania are producing substantial volumes of natural gas where little production existed a decade ago. Although the “toll-model” of pipelines, storage assets and processing facilities still thrives, the long-term growth opportunities in infrastructure are attracting investors willing to reinvest cashflows back into accretive projects.

As a result, energy infrastructure businesses are evolving beyond MLPs, as their need for capital has not always aligned with traditional, yield-oriented MLP investors. Simplification, in which an MLP and its General Partner merge into a single corporate entity, has broadened the investor base. MLPs are nowadays an important but shrinking portion of the opportunity set.

The secular theme of American Energy Independence reaches beyond MLPs, and this is why we’re launching the American Energy Independence Index. It’s designed to incorporate those infrastructure businesses that are critical to supporting our growing energy needs. It includes both MLPs and corporations; some large Canadian companies as well as American ones, since infrastructure is highly integrated between the U.S. and Canada. In fact, the market capitalization of the corporations in the index is $300BN, approximately the same as the Alerian MLP Index. Those investors who seek energy infrastructure exposure via MLPs are limiting themselves to a steadily shrinking subset of the relevant companies. Energy infrastructure today is about growth, and many large businesses have adopted a traditional corporate structure so as to attract global investors, rather than simply those wealthy Americans who will accept the complexity of K-1 tax reporting.

Moreover, investing in MLPs via mutual funds or ETFs usually comes with the substantial tax drag noted above (see Are You in the Wrong MLP Fund?).

The American Energy Independence Index is designed to track the companies of our energy future. The Shale Revolution is bringing the U.S. closer to energy independence. Increasing volumes of hydrocarbons need to be gathered, processed, transported and stored, all of which requires additional infrastructure.

Today the index is almost fully infrastructure supporting oil, natural gas, refined products and NGLs, because those reflect our energy mix and offer reliable cashflows. Hydrocarbons will remain the dominant source of our energy for the foreseeable future, and the index consists of energy infrastructure offering consistent economic returns over the long term. This excludes coal, since it moves by rail and ship where barriers to entry are lower, and so it is not included in the index. Although the transportation and storage of renewable energy isn’t a business today, as these technologies mature and their infrastructure begins supporting similarly stable cashflows, their place in the index will grow. The American Energy Independence Index is designed to evolve with America’s changing energy needs. It is biased towards energy infrastructure that provides reliable cashflows growing over the long term.

Since 2010 the American Energy Independence Index has reflected the performance of the broader energy infrastructure sector. It has moved with the Alerian Infrastructure Index but has performed better because it’s not limited to MLPs. It better reflects the future of financing infrastructure, which still uses the MLP vehicle but relies on it less than in the past. Almost all the ETFs and mutual funds in the sector focus too narrowly on MLPs, instead of covering the entire universe of energy infrastructure opportunities.

In a few weeks we will be making available an opportunity to invest in the index. We think it represents a superior way to participate in our energy future, as America heads towards Energy Independence.

.avia-image-container.av-1tl1wi-9d06f7c53ba5477c219e6257dcc20bc9 img.avia_image{ box-shadow:none; } .avia-image-container.av-1tl1wi-9d06f7c53ba5477c219e6257dcc20bc9 .av-image-caption-overlay-center{ color:#ffffff; }

Disclosures:

References to indexes are hypothetical illustrations of aggregate returns and do not reflect the performance of any actual investment. Investors cannot invest in an index and do not reflect the deduction of the advisor’s fees or other trading expenses. Actual realized returns will depend on, among other factors, the value of assets and market conditions at the time of disposition, any related transaction costs, and the timing of the purchase. The Index’s performance does not represent the results of actual trading, but was achieved by means of retroactive application of a model designed with the benefit of hindsight. Results may not reflect the impact that material economic and market factors might have had on adviser’s decision-making if adviser were actually managing client assets.