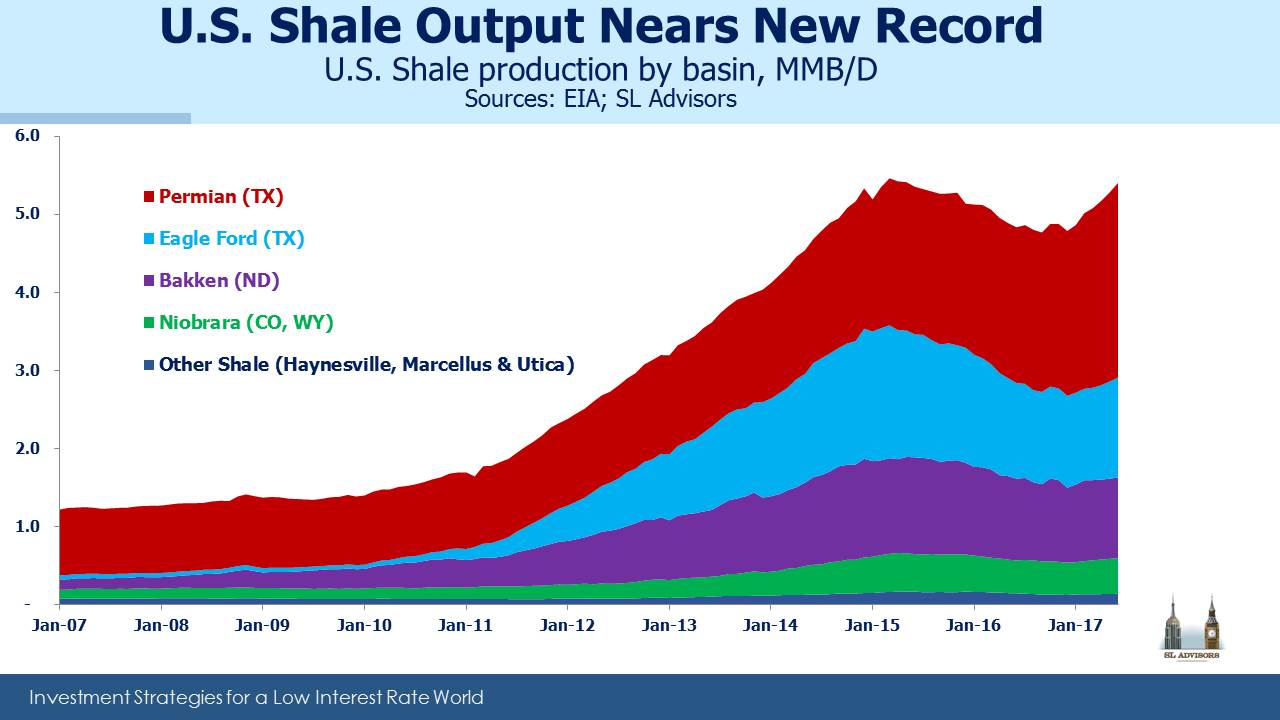
Plain Talk On Oil Production

Last Wednesday Plains All American (PAGP) held their Investor Day. These events typically afford investors the opportunity to get more detail on the company, but Plains also has a sophisticated macro view of the oil market. As the biggest crude oil transportation company in America they naturally care a lot about North American output. CEO Greg Armstrong invariably provides many great insights. Below are some selected slides from their presentation.

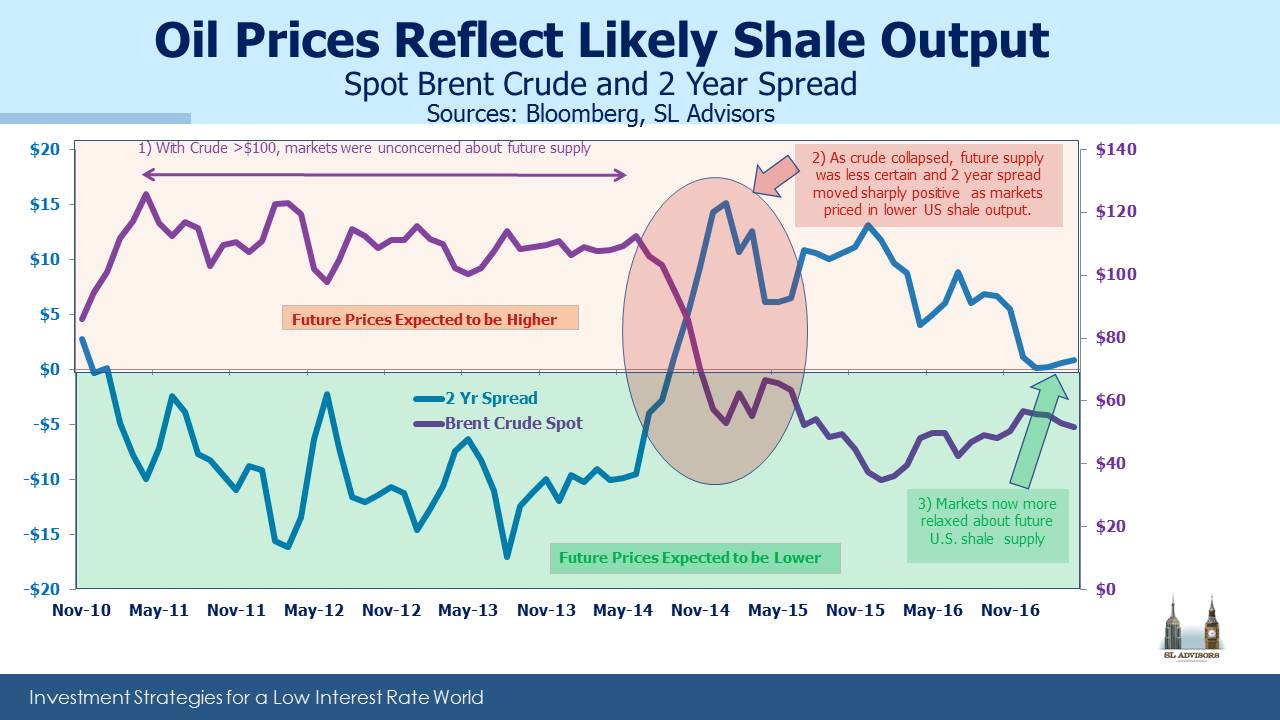
Plains’ research focuses more on forecasting volumes rather than prices; as befits an energy infrastructure operator, the volumes of crude oil moved are more important than the value, although there’s clearly a linkage because high prices stimulate output.

.avia-image-container.av-144z1l-8ce5a6c4ddb34e21599f7608059a4a4a img.avia_image{ box-shadow:none; } .avia-image-container.av-144z1l-8ce5a6c4ddb34e21599f7608059a4a4a .av-image-caption-overlay-center{ color:#ffffff; }

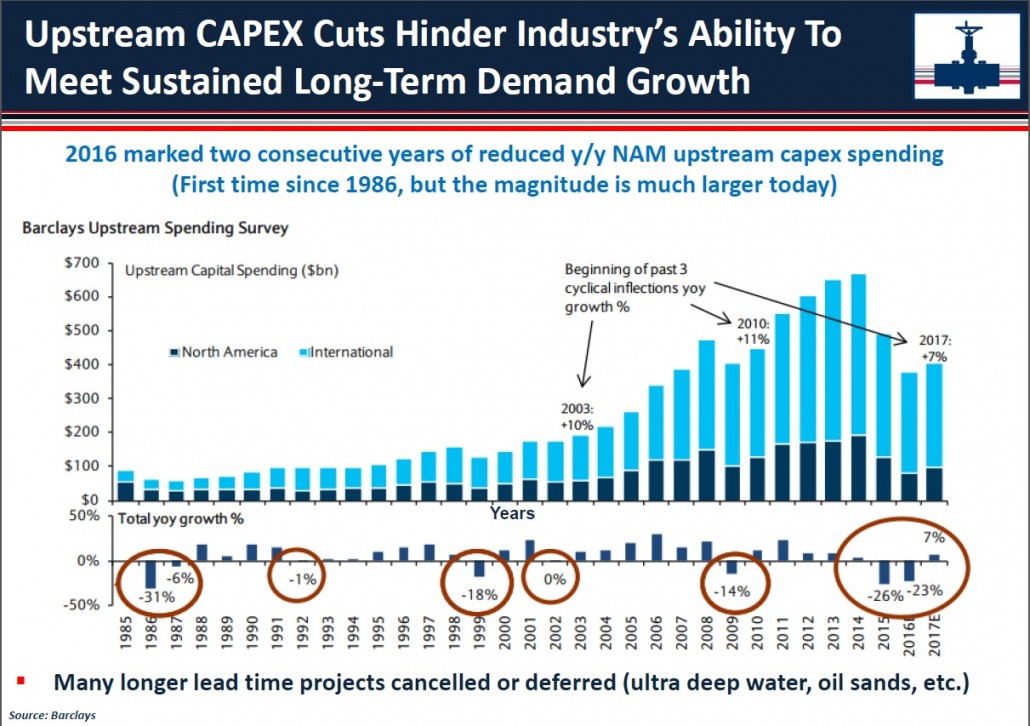
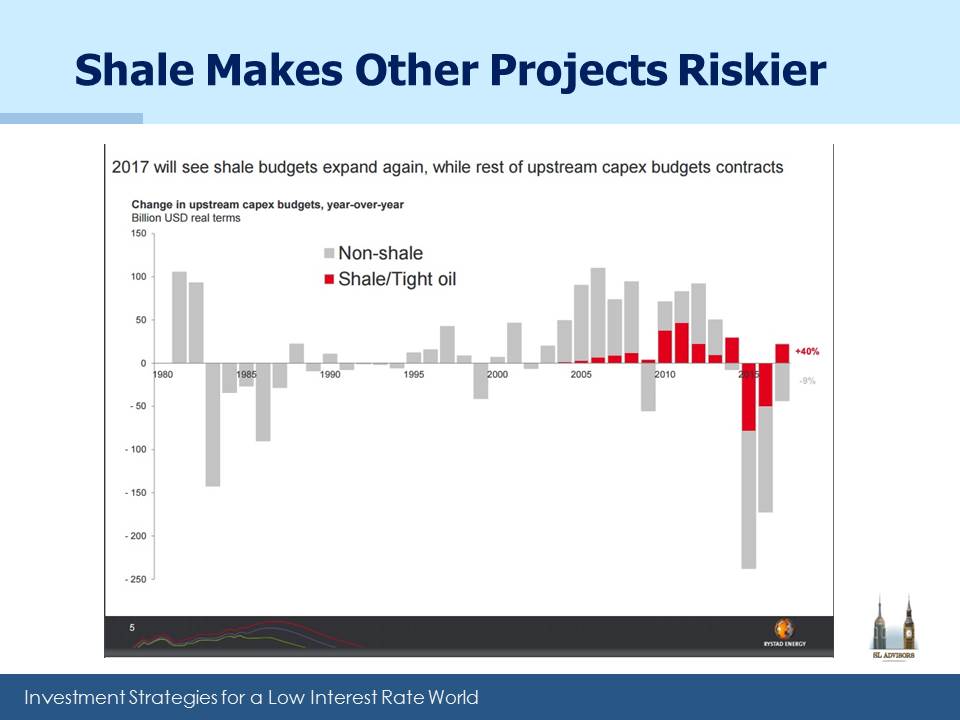
The first slide notes the sharp drop in upstream capex budgets which will eventually manifest itself through constrained supply. The 2015-16 drop in budgets is the biggest in thirty years. There is little excess output capacity, and notwithstanding recent weakness in oil prices, over time the market will be increasingly vulnerable to a spike.

.avia-image-container.av-8xufmx-12bbdaec62167d8a5160a677053d2a10 img.avia_image{ box-shadow:none; } .avia-image-container.av-8xufmx-12bbdaec62167d8a5160a677053d2a10 .av-image-caption-overlay-center{ color:#ffffff; }

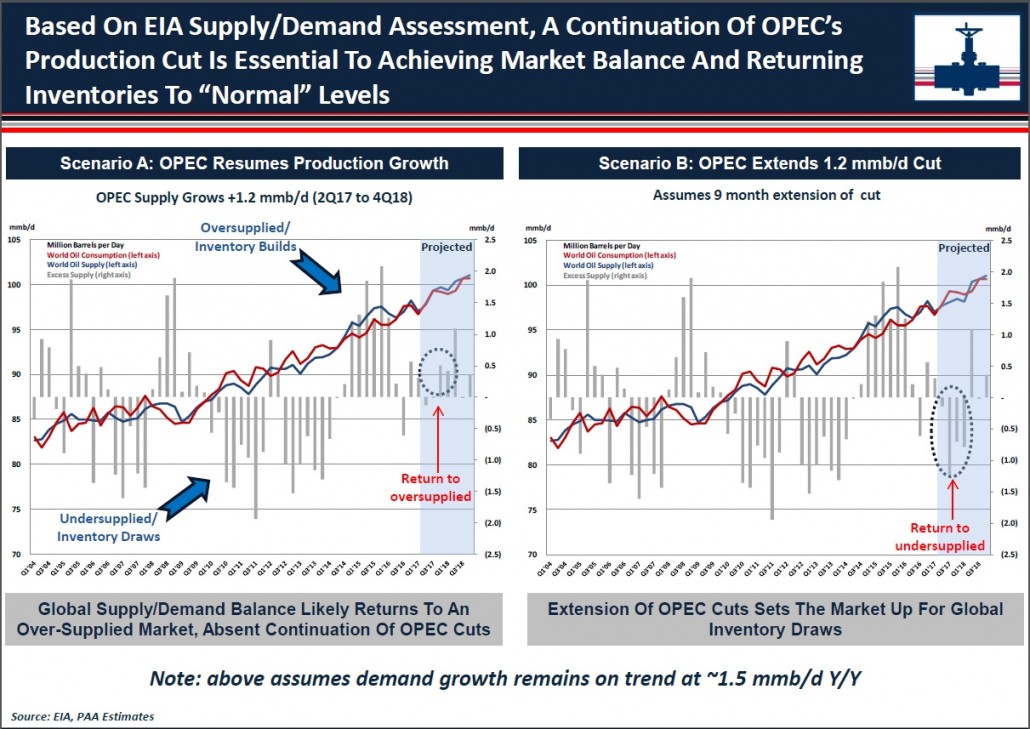
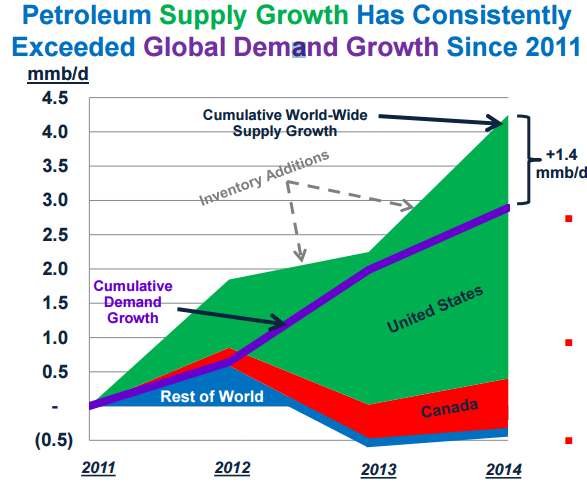
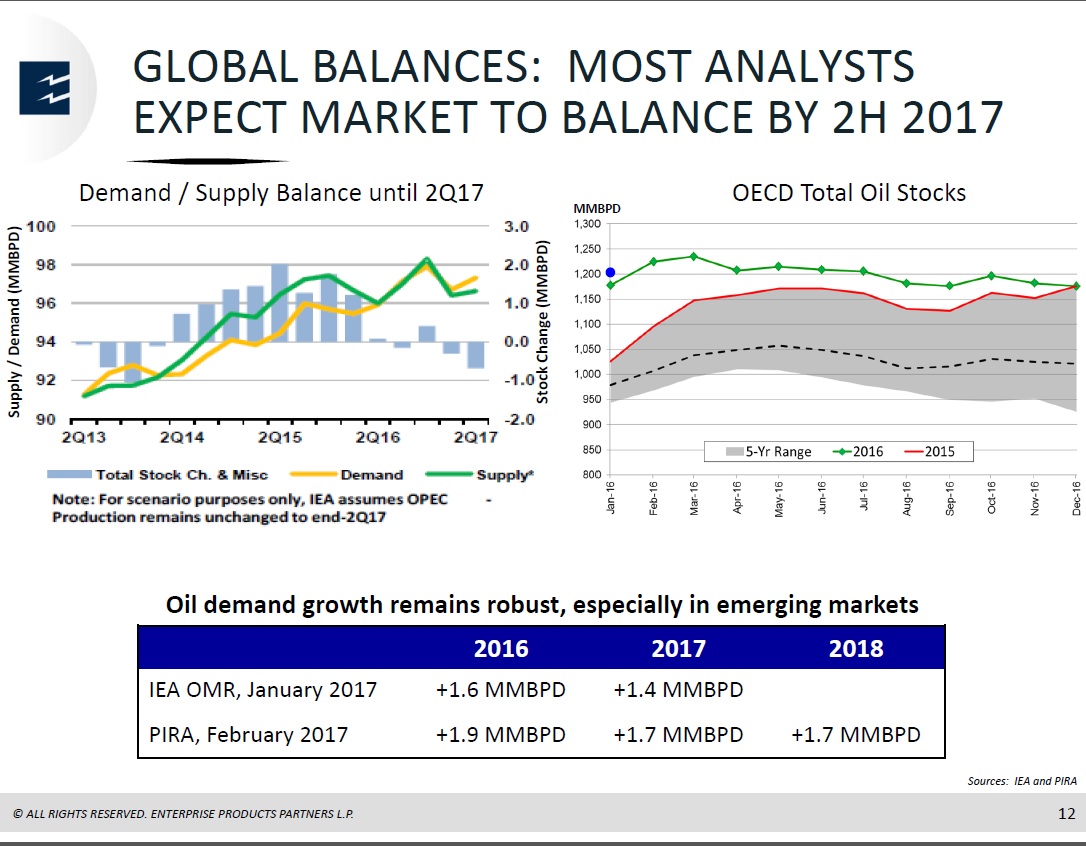
The second slide notes the impact of OPEC’s production cuts. Plains held their Investor Day a day before the OPEC meeting which extended the cuts through 1Q18. Note that the right hand chart assumes the 1.2 Million Barrel/Day (MMB/D) OPEC cut is extended, which should approximately absorb global inventories in excess of historic averages. Russia and other non-OPEC producers are expected to make up the balance of the 1.8MMB/D contained in their announcement. In short, Plains believes the market will balance as a result.

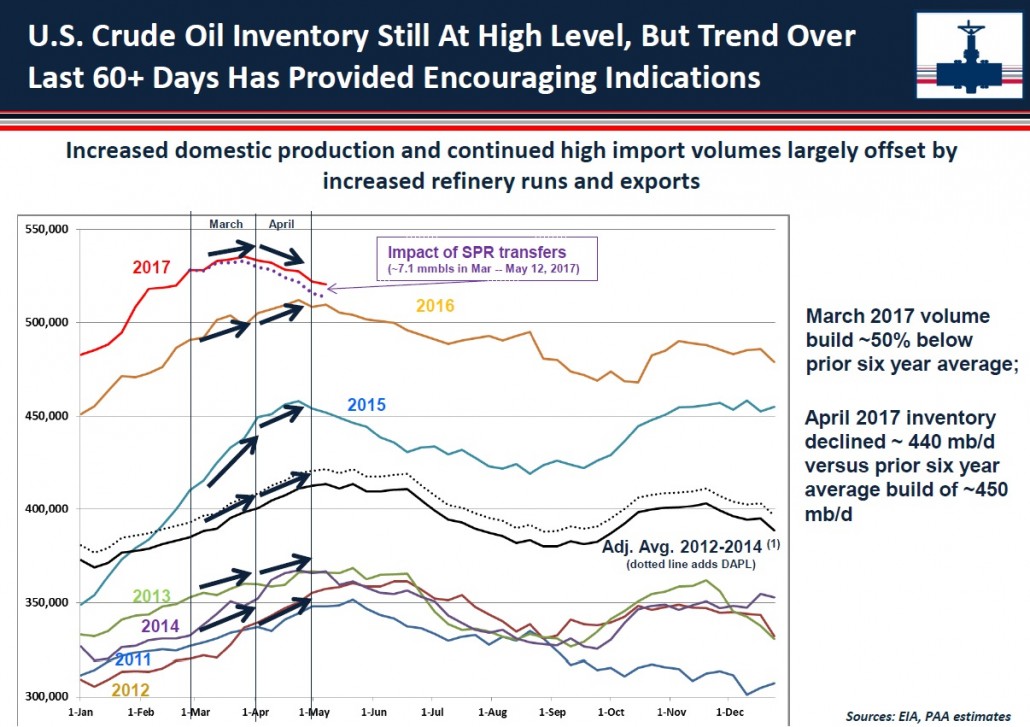
This slide on U.S. inventories notes their currently high level compared with prior years but also that recent builds have been substantially lower than in the past.

.avia-image-container.av-shqg9-9290ac869099a3a2db20633f180f74bd img.avia_image{ box-shadow:none; } .avia-image-container.av-shqg9-9290ac869099a3a2db20633f180f74bd .av-image-caption-overlay-center{ color:#ffffff; }

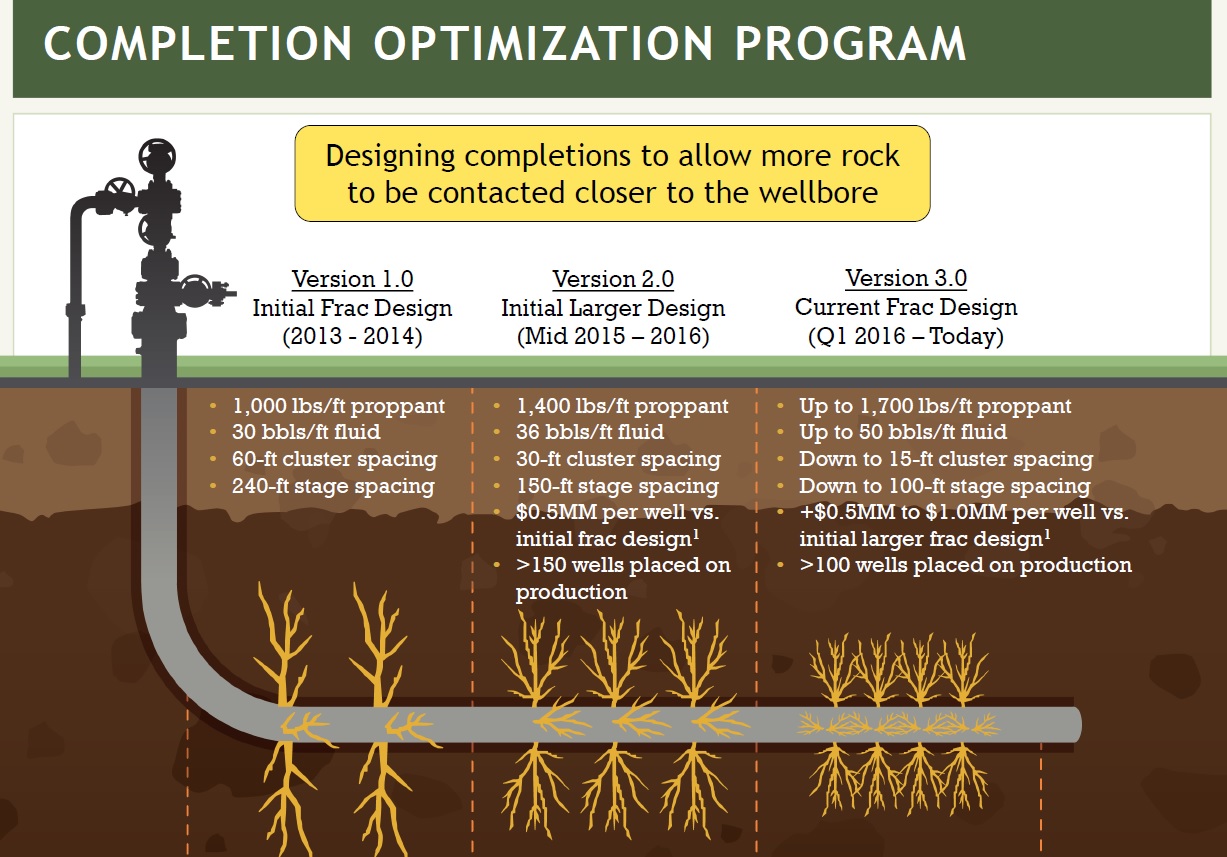
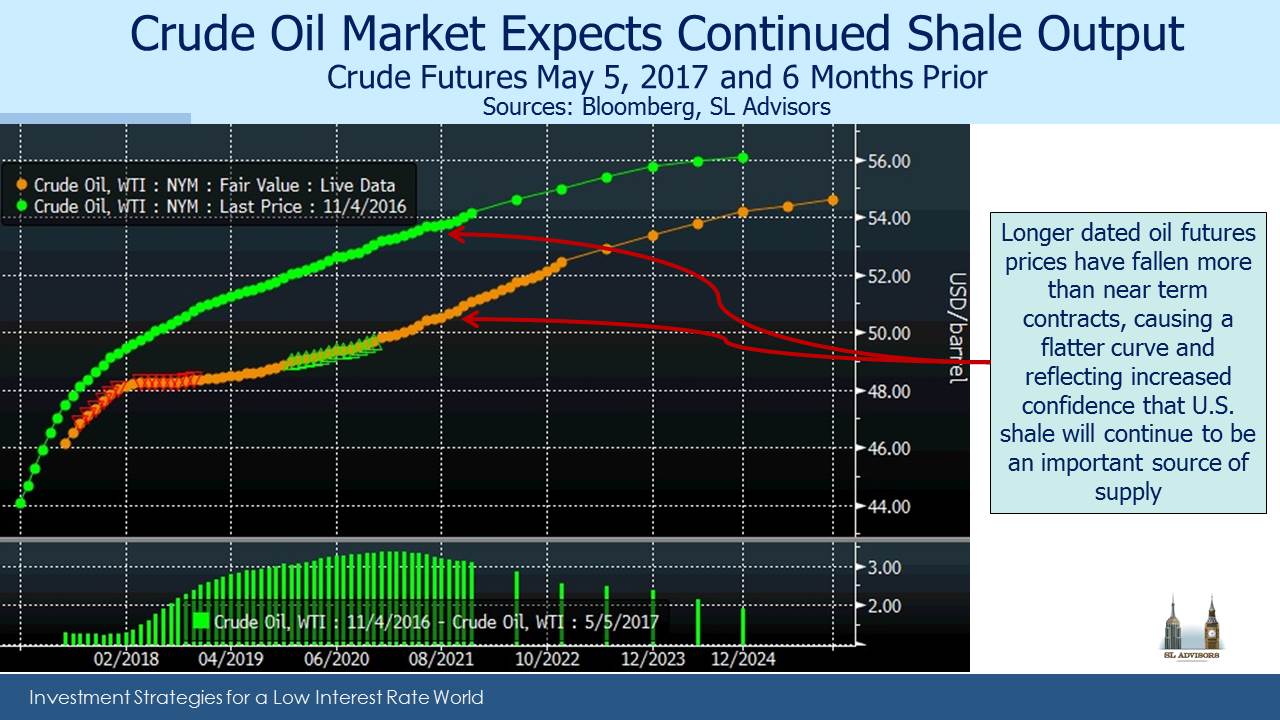
During the Q&A session, CEO Armstrong referred to shale drilling as a manufacturing process, a common analogy nowadays because the short cycle nature of shale projects (see Oil Futures Say Shale’s Here to Stay) results in fast return of capital with commensurately less risk. Much of this higher capital velocity is driven by improving efficiencies (see Extracting Supply Forecasts from Oil Futures).

.avia-image-container.av-574wax-679c8cb907fc411455f65c36894f349b img.avia_image{ box-shadow:none; } .avia-image-container.av-574wax-679c8cb907fc411455f65c36894f349b .av-image-caption-overlay-center{ color:#ffffff; }

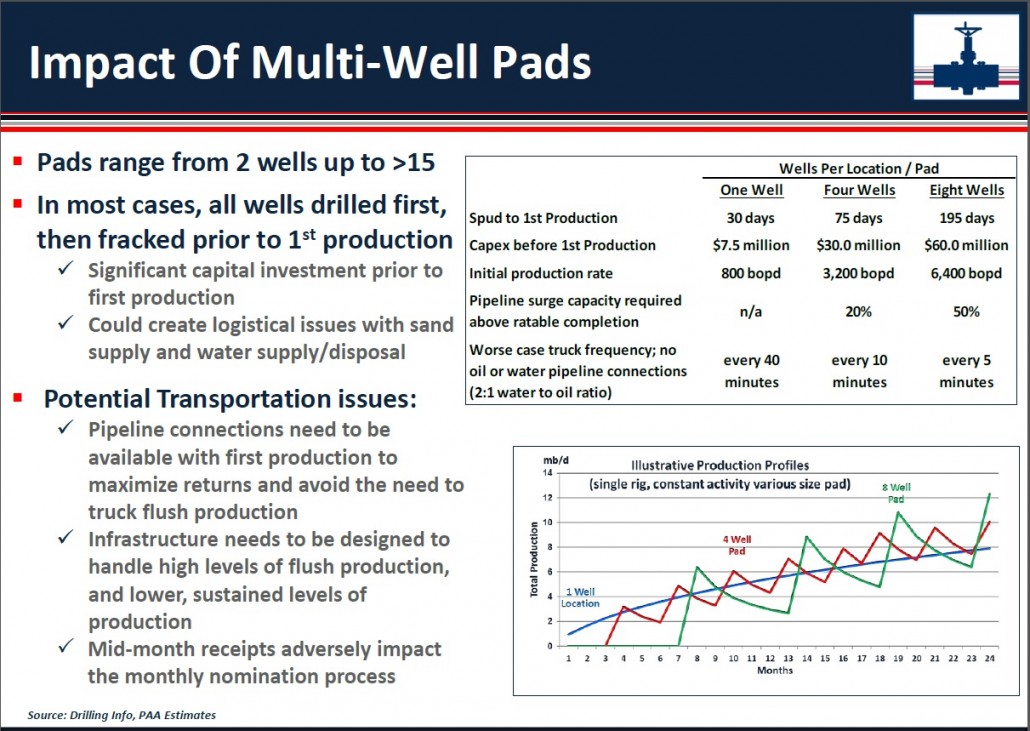
One example of efficiencies is the use of multi-well pads. This can sharply increase the production from each rig in use, but comes with logistical challenges. Typically, all the wells are drilled first, then fracked. This lengthens the time from initiation until production and increases the upfront capital investment; it also results in more variable output as the bottom right illustration in the above slide shows, with volumes coming in spurts. The uneven output creates additional challenges for the Exploration and Production (E&P) company as well as the supporting infrastructure.

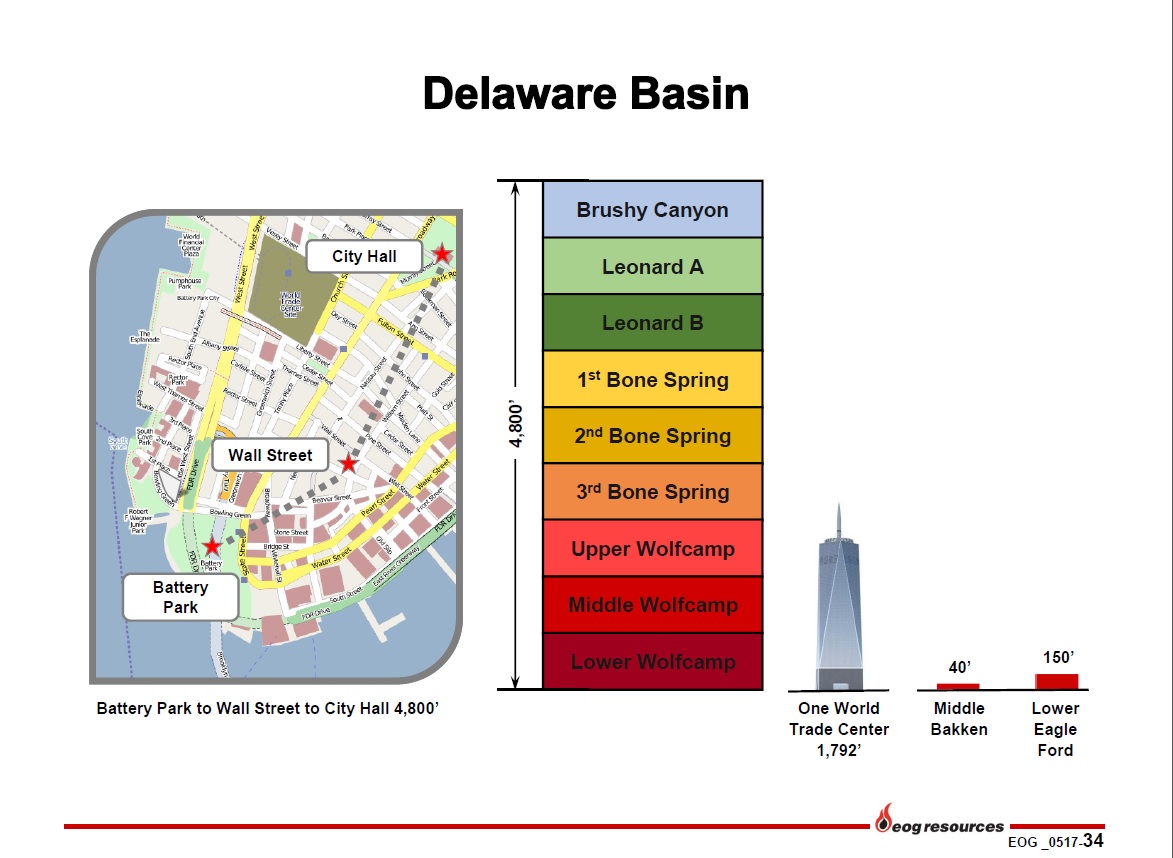
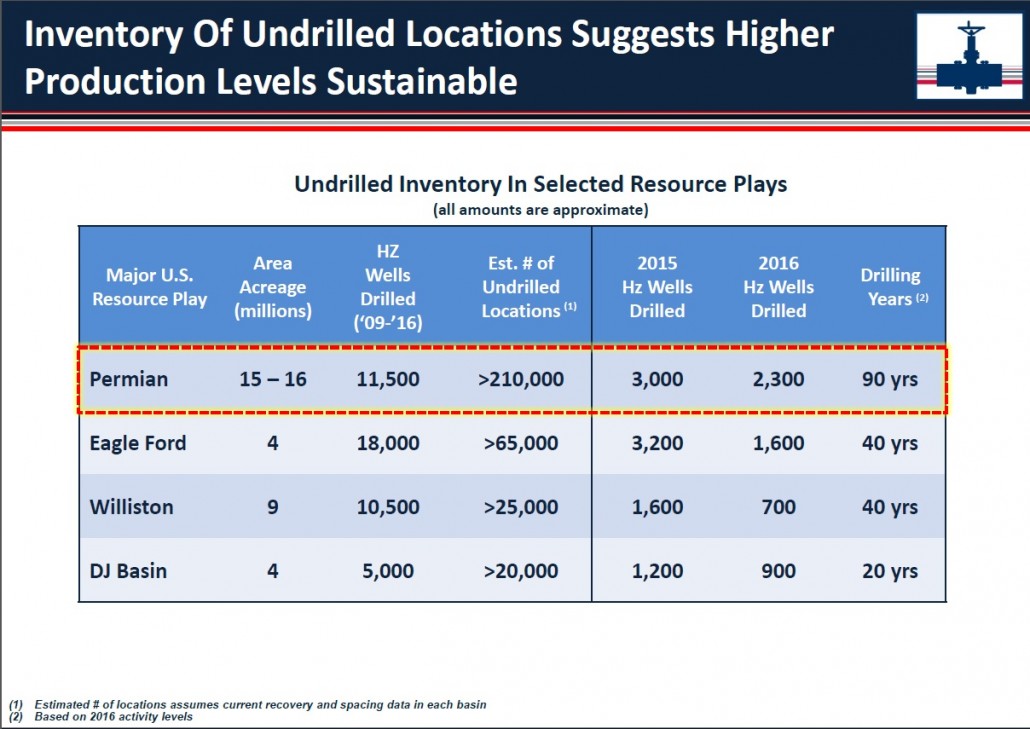
Today there is far greater certainty about the returns from a given level of investment than has traditionally been the case for the energy industry. In fact, Armstrong noted that forecasting production relies heavily on knowing how much capital E&P companies will commit (which is itself dependent on expected returns). The reasonably high visibility around output given capex informs the table below, showing several decades of resource availability. In a memorable quote, Greg Armstromg said, “The world may not need another million barrels a day of Permian crude, but it’s coming.”

.avia-image-container.av-4cc56h-5f5dcc3ff5d94a539833f0177e7f37ea img.avia_image{ box-shadow:none; } .avia-image-container.av-4cc56h-5f5dcc3ff5d94a539833f0177e7f37ea .av-image-caption-overlay-center{ color:#ffffff; }

Lastly, investors often ask whether there is excess infrastructure. The answer is never simply yes or no. New pipelines are typically built in anticipation of growing supply. Production ramps up steadily, whereas a pipeline offers capacity only when it’s completed.

.avia-image-container.av-1w1zll-23ba68f4e574ee6469d86879432608f9 img.avia_image{ box-shadow:none; } .avia-image-container.av-1w1zll-23ba68f4e574ee6469d86879432608f9 .av-image-caption-overlay-center{ color:#ffffff; }

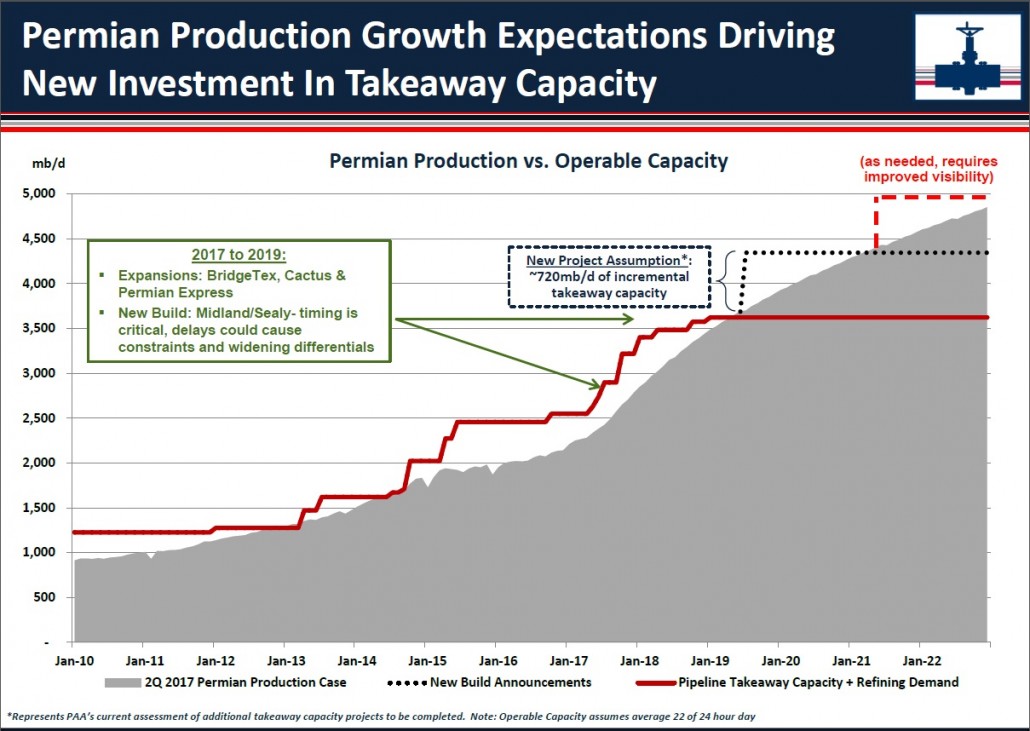
The result is, when you plot pipeline capacity and supply of product, you get a chart like this one. The market seeks a narrow gap between the red line (pipeline takeaway capacity plus refinery demand) and the grey area (production). But capacity comes online in a step function, while production moves more gradually. Too much capacity can hurt pipeline margins, but insufficient capacity can leave E&P companies scrambling for alternative transportation (rail or truck, both much more expensive). The challenge for companies like Plains is to build charts like this correctly and then plan their infrastructure investments accordingly. It’s why they focus so carefully on the fundamentals driving their E&P customers.

On a lighter note, I can report that hydraulic fracturing (“fracking”), the process by which water is injected at high pressure into the porous rock holding hydrocarbons, thereby creating millions of cracks and releasing it, has found its way into popular culture. Brockmire, a show available on Amazon Prime, centers on a baseball announcer covering a minor league team in Pennsylvania (think Marcellus Shale) called the Frackers. A local E&P company sets its sights on the (poorly attended) Frackers stadium for waste water disposal. I won’t spoil the plot any further, but discussion of fracking and shale are no longer limited to members of the energy sector. Our thanks to MLP investor Michael Hickey of Forest Park, IL for drawing this to our attention.

We are invested in PAGP


U.S. Oil Output Approaches Record

With the resurgence in U.S. crude oil production over the last year, it was only a matter of time until shale output reached a new record. Based on recent actual production and the EIA’s forecast for a June increase of 122 MB/D (thousand barrels a day), the peak of March 2015 is only 57 MB/D away.

.avia-image-container.av-cr175-3777fc236c50a9392790e78dd0675b20 img.avia_image{ box-shadow:none; } .avia-image-container.av-cr175-3777fc236c50a9392790e78dd0675b20 .av-image-caption-overlay-center{ color:#ffffff; }

The Permian Basin in West Texas has been the principal driver of this increase in production. The depth of the play, as illustrated in the slide from a recent presentation by EOG (displayed above), holds substantial reserves and has benefited from extraordinary improvements in efficiency by the operators there which has brought down break-even levels. Many have underestimated the ability of the U.S. private sector to harness technology as effectively as they have. This is activity that OPEC expected to choke off through a ruinously low price of oil. Instead, they were forced to switch gears last November and concede steadily increasing market share to U.S. producers. Recently, OPEC quietly raised their 2018 forecast of total U.S. oil production (shale and conventional) to 10 MMB/D (million barrels a day). Given the capital being invested by drillers it’s plausible that by 2018 the U.S. could be the world’s biggest crude oil producer.

.avia-image-container.av-2oc2td-cd37b9645f6f8b263b93ad44b3b024a4 img.avia_image{ box-shadow:none; } .avia-image-container.av-2oc2td-cd37b9645f6f8b263b93ad44b3b024a4 .av-image-caption-overlay-center{ color:#ffffff; }

The most visible recent pipeline protest was against Energy Transfer’s (ET) Dakota Access Pipeline (DAPL) earlier this year. One of President Trump’s first actions was to correctly overturn an Obama-era executive order blocking its completion. But public demonstrations against fossil fuels continue elsewhere, even if their mentally agile adherents comfortably drive to join their friends in shouting against oil and natural gas.

As a consequence, managements of energy companies are recognizing that they need a strategy to deal with such protests, since a delayed pipeline can quickly become costly. At their Investor Day earlier this month, Williams Companies (WMB) CEO Alan Armstrong discussed their evolving attitude towards groups that seek to frustrate the implementation of infrastructure projects. Striving to learn from ET’s experience with DAPL, Armstrong described a policy of actively engaging with opponents to find common ground. He also noted the potential of other groups, such as construction unions keen for the jobs, to line with WMB in pushing projects forward.

Expect to see more savvy use of media by energy companies, including video of American workers making America Great accompanied by fast-paced, inspiring music. The WMB Analyst Day included a couple of short clips. Here’s another on WMB’s blog page (called “Pipe Up”), extolling the benefits of their Northeast Supply Enhancement project.

The education of investors about tax-inefficient MLP funds received a welcome boost from Barron’s. A letter from Mike Flaherty noted the tax drag on many poorly structured MLP funds included in a recent article, “Best ETFs for Income“. Flaherty correctly pointed out the value-destroying corporate tax liability incurred by AMLP and AMZA amongst others. Asked to respond, one PM blandly referred investors to seek tax advice, which is what you’d say if you ran a poorly designed fund and wished to change the subject. Barron’s hasn’t yet assigned a journalist to write on this topic, in spite of our suggestion that they’d be performing a useful service to countless MLP fund investors. But perhaps they will soon.

We are invested in Energy Transfer Equity (ETE) and WMB


Extracting Supply Forecasts from Oil Futures

We thought it would be interesting to expand a little more on the notion that crude oil prices reflect the market’s confidence that oil in the future will be available on approximately the same terms as today (see Oil Futures Say Shale’s Here to Stay). The tool we’re using is the two year spread – the difference between the spot price of crude and the futures price two years hence. The chart below plots spot Brent crude and this two year differential. We used Brent because it’s more reflective of the global oil price. Until late 2015 U.S. crude oil exports were limited to Canada, so the U.S. benchmark WTI reflects some price distortions caused by the export ban. However, it broadly conveys the same information as Brent.

.avia-image-container.av-h8g6bs-2de7e2166e8b48bc020163e73e3027cc img.avia_image{ box-shadow:none; } .avia-image-container.av-h8g6bs-2de7e2166e8b48bc020163e73e3027cc .av-image-caption-overlay-center{ color:#ffffff; }

From 2010-2014, with crude oil above $100, the two year spread was negative (known as in backwardation). Crude futures two years out were trading at $5-$15 less than spot. This was the time of the great ramp up in U.S. shale output, and although export constraints kept it in the U.S. by reducing U.S. imports the global market felt its effects.

In 2014, Plains All American published a great chart which showed that North American output had been equivalent to fully all of the new global demand for crude oil over the prior four years. As we all know, OPEC responded to this concurrent loss of market share by allowing prices to collapse later that year.

.avia-image-container.av-1lotwo-cf62ff77a1c0dd16e9ce7641718a77c5 img.avia_image{ box-shadow:none; } .avia-image-container.av-1lotwo-cf62ff77a1c0dd16e9ce7641718a77c5 .av-image-caption-overlay-center{ color:#ffffff; }

As spot crude dropped, the two year spread moved sharply positive (known as contango). There are many factors driving the slope of the crude curve, not least of which is storage for near term contracts. High levels of inventories will tend to depress spot prices versus future ones, so the spread offers a guide with these caveats. With that said, two years ago the market was signaling that supply would only be available at sharply higher prices. The market was reflecting an expectation that OPEC’s strategy of bankrupting large swathes of the U.S. shale industry would be successful. Had it happened, the drop in supply would have allowed crude to return to substantially higher prices and vindicated OPEC’s strategy.

OPEC conceded defeat in November and agreed to cut production. This allowed prices to rise and in recent months has brought the two year spread back towards $0. Today’s oil prices reflect confidence that future supply will be available on roughly the same terms as today. Since capex commitments into conventional oil plays keep falling (see Why Shale Upends Conventional Thinking) and shale is bucking the trend with increased drilling budgets by the Exploration and Production (E&P) companies active there, a logical inference is that oil traders expect continued increases in shale output.

.avia-image-container.av-en54eg-1825563d43c2f969fbc0cd4179d26df5 img.avia_image{ box-shadow:none; } .avia-image-container.av-en54eg-1825563d43c2f969fbc0cd4179d26df5 .av-image-caption-overlay-center{ color:#ffffff; }

The success of shale drilling is due in no small part to continued technological innovation. E&P companies such EOG and Pioneer include examples of the impact of IT on their activities. American technological innovation is increasingly what’s driving the Shale Revolution. Below are six slides from earnings presentations to illustrate:

.avia-image-container.av-cgmwko-a5ba7ce9fbb03e929a122e3fc2bec18d img.avia_image{ box-shadow:none; } .avia-image-container.av-cgmwko-a5ba7ce9fbb03e929a122e3fc2bec18d .av-image-caption-overlay-center{ color:#ffffff; }

Fracking 3.0 focuses on more targeted areas supported by detailed geological analysis to identify the best spots to drill. It also uses more grades of sand including very fine grains, resulting in greater variety of cracks being propped open as the water/sand mixture ruptures the rock.

.avia-image-container.av-11jiso-85c4ad8ecf467e90f1570ecf2696251c img.avia_image{ box-shadow:none; } .avia-image-container.av-11jiso-85c4ad8ecf467e90f1570ecf2696251c .av-image-caption-overlay-center{ color:#ffffff; }

Often the drill bore used to drill the well is remotely guided by an operator sitting in a control room miles away. Increasing data mining allows for greater precision in drilling the most productive spots.

.avia-image-container.av-8l3jiw-6d39a1b7d246d043e5ee7c21530de036 img.avia_image{ box-shadow:none; } .avia-image-container.av-8l3jiw-6d39a1b7d246d043e5ee7c21530de036 .av-image-caption-overlay-center{ color:#ffffff; }

Artificial Intelligence and Predictive Analytics play a role. Often, today’s oil drillers leave their hard hat at the door to sit in front of a computer screen.

.avia-image-container.av-773ruw-b9b96c705537e67346eddfa32fd31fc7 img.avia_image{ box-shadow:none; } .avia-image-container.av-773ruw-b9b96c705537e67346eddfa32fd31fc7 .av-image-caption-overlay-center{ color:#ffffff; }

This slide from EOG illustrates the extraordinarily deep layer of exploitable rock formation in the Delaware (Permian) Basin in West Texas, compared with much shallower opportunities in the Eagle Ford (South Texas) and Bakken (North Dakota). They compare the thickness of the Delaware Basin play with the distance from Battery Park in lower Manhattan to City Hall. The Permian makes possible multi-layer drilling which greatly improves the economics.  It’s why there is so much interest in the Permian.

.avia-image-container.av-6im7qw-e9510d098b8ecdd44a74f191512c1689 img.avia_image{ box-shadow:none; } .avia-image-container.av-6im7qw-e9510d098b8ecdd44a74f191512c1689 .av-image-caption-overlay-center{ color:#ffffff; }

This illustrates how EOG has been able to raise the percentage of its wells defined as “Premium Standard” based on meeting a certain minimum  After Tax Rate of Return (ATROR). On their earnings call last week EOG had Sandeep Bhakhri, Chief Information and Technology Officer. Bhakri provided a summary of EOG’s intense use of data to make accurate, fast decisions. EOG is a leader in providing actionable data to front-line personnel which allows them to adapt drilling plans as they receive new information. As he said, “We built 10 web-based self-service applications, eliminating the need for employees to ask each other what questions and to instead focus on why and how questions.”

.avia-image-container.av-3hx3u0-da0295fe99e7b7b0c2b2285bf300e44d img.avia_image{ box-shadow:none; } .avia-image-container.av-3hx3u0-da0295fe99e7b7b0c2b2285bf300e44d .av-image-caption-overlay-center{ color:#ffffff; }

Finally, this slide is EOG’s analysis of the required break-even for various sources of crude supply globally. U.S. shale is the swing producer because its opportunities are short-cycle, able to return capital invested within a matter of quarters. But shale is no longer the marginal producer. Based on this chart, the price of crude oil will eventually need to move higher in order to draw enough supply to meet demand.

E&P companies are the customers of MLPs, so their success is obviously important. Recent earnings reports from E&P companies, as well as the energy infrastructure businesses that are vital in getting their hydrocarbons to market, support growing output. This is confirmed by the U.S. Energy Information Administration, which recently increased its forecast of U.S. crude output to an average of 9.3 MMB/D for 2017 and nearly 10.0 MMB/D in 2018.

This greater certainty about future supply is reflected in the narrowing dispersion of price forecasts for crude oil (see U.S. Oil Output Continues to Grow). Steadily growing hydrocarbon output is expected by the energy industry and the U.S. Federal government. Even OPEC expects more U.S. oil production; last week they increased their forecast U.S. growth by 285K barrels a day, to 820K. It’s a factor causing OPEC to likely extend last year’s production cuts, which further concedes market share to shale.  The only place where growing U.S. output is seemingly not expected is in the stock prices of MLPs, as investors know only too well. The last chart, from midstream business Enterprise Products (EPD), shows that it’s not only U.S. E&P companies expecting the market to balance at current/planned levels of supply.

.avia-image-container.av-1wbf20-969a33381d3f27900de3261ca7f2c5c8 img.avia_image{ box-shadow:none; } .avia-image-container.av-1wbf20-969a33381d3f27900de3261ca7f2c5c8 .av-image-caption-overlay-center{ color:#ffffff; }

The strong correlation between crude and MLPs from 2015 is well remembered by many and is part of the history of every risk model, which probably reinforces today’s connection. But the continued operating efficiencies of U.S. shale drillers are supporting higher levels of production at lower prices than many investors expected. A key difference between 2015 and today is the two year oil spread, which reflects a far more positive view of sustaining domestic production than was the case during the MLP Crash. MLP investors shaken by the recent drop in the sector would do well to consider the information reflected in other markets.

We are invested in EPD


Buffett’s Hedge Fund Bet

We alluded to this in May’s newsletter. About to lose a $1MM bet with Warren Buffett over whether hedge funds could beat stocks over ten years, hedge fund investor Ted Seides has brazenly shunned obscurity and instead offered an amusing public justification. It can be summarized thus: although I lost money I wasn’t wrong. I’ll refrain from saying too much more, although Seides offers a target-rich environment. While the comments on articles are rarely worth perusing, the dozens already posted with his article offer a predictable real world riposte. Seides reminds me of a proprietary trader who once worked for me at JPMorgan. His trading losses were similarly not his fault, but were the unavoidable consequence of intelligent bets suffering from unforeseeable outcomes. He later went on to be a hedge fund investor (see Wall Street Potholes Pp 43-44).


Oil Futures Say Shale's Here to Stay

A couple of months ago (see Why Shale Upends Conventional Thinking) I promised to spread constructive thoughts about Master Limited Partnerships (MLPs) across the ensuing weeks and months rather than use them all up on the first drop in prices. Two months and several percent later such parsimony was well advised. If your preference is to invest with a stop-loss, thus ceding to others the timing of your exit and avoiding the need to think too hard, MLPs may not be your best choice.

Lower oil prices may lead to lower U.S. output (although it hasn’t happened yet) and consequential pressure on the owners of infrastructure as excess pipeline and storage capacity build. If the 2015 MLP collapse was an epic, 2017 is so far a single episode in a mini-series of unknown length.

The bear case is plain enough. U.S. oil production remains stubbornly high (at least from OPEC’s perspective). Since crude oil is now below the price that prevailed when OPEC shifted strategies, U.S. shale output is more than offsetting last year’s agreed production cuts. The agreement is being surprisingly well respected with few reports of cheating. However, while OPEC members are complying with production cuts their exports remain at previously high levels, drawing down inventories. ClipperData’s Matt Smith pointed this out last week, adding that April was the first month when Saudi Arabia cut exports in what may presage a more meaningful reduction in global supply.

A certain amount of self-confidence is necessary to buy securities that others are selling — how else does one buy, anyway? But just because one is bullish does not render the naysayers stupid. If crude oil falls far enough production in the U.S. and elsewhere will slow. Shale drillers are not immune to prices, and in fact are better able to respond than most due to the short-cycle nature of their projects (see What Matters More, Price or Volumes?). The secular improvements in horizontal drilling and hydraulic fracturing are relentlessly lowering break-even prices for the Exploration and Production (E&P) companies that are active there. These E&P firms are the customers of MLPs, so we care very much about their success.

There is a type of circular irony here, in that continued growth in U.S. output aided by productivity improvements is causing energy sector stocks to weaken. The very success of shale in America ought to be a problem for others, not for domestic E&P companies or the MLPs serving them. For now, production and price are negatively correlated – shale supply stubbornly refuses to surrender to lower prices. Or more realistically, efficiency improvements maintain production higher than it might otherwise be but nonetheless lower than would be the case at, say, $60 a barrel.

Production may slow and the worriers be proven right. So let’s complicate matters by considering a number of facts shared in the many earnings reports over recent days.

EQT Corporation (EQT) reported lower than expected natural gas output because, as CEO Steven Schlotterbeck explained, “A couple of our frac contractors decided to pay us the penalties to take their frac crews to jobs that were more profitable.” In other words, demand in the Permian in West Texas is sufficiently strong to induce frac suppliers to break contracts in the Marcellus, in Pennsylvania.  Think about this, you have a profitable shale well that you wish to drill and have contracted a crew to drill it and instead they pay you a penalty not to drill the well because economics are that much better elsewhere.

There are many indications of new capital being invested in shale drilling. Western Gas (WES) reported that their sponsor Anadarko (APC) had sold Eagleford and Marcellus assets in 1Q17. WES owns infrastructure supporting these plays, and as a result CEO Benjamin Fink said, “we therefore expect increased drilling activity behind each system.”

Similarly, ENLK’s Barry Davis noted of their sponsor, Devon Energy (DVN), “Devon recently announced the potential divestiture of certain properties in Johnson County, an area that was not competing well for ongoing capital investments in their portfolio, from an EnLink perspective, we could benefit from a transition of those assets from Devon to a producer who is committed to developing the area over the long term.”

APC and DVN are not short of investment opportunities, but are concentrating their capex budgets on their best ones. They’re evidently finding interested buyers in assets whose sale proceeds will finance even more profitable opportunities. The new money will work those assets harder than the previous owners, which WES and ENLK see as good for them. In commenting on the Permian, ENLK’s Barry Davis further noted, “In the core areas where we are positioned, oil weighted breakeven prices or (sic) around $30s per barrel making economics very attractive, at today’s prices the resulting rates of return are in the range of 80% to 100%.”

Early last year, during what turned out to be the late stages of the MLP MOAB (Mother Of All Bears), we looked at Crestwood (CEQP) and their bankrupt E&P customer Quicksilver Resources (see How Do You Break a Pipeline Contract?). Owning a pipeline that supports a play whose owner can’t pay his debts is not what MLP investors like, and some wondered if CEQP would wind up owning infrastructure that was under-used or repriced.

Quicksilver’s assets were sold in bankruptcy court to Bluestone Natural Resources. Fifteen months later, CEQP’s CEO Robert Phillips commented, “And finally, in the Barnett, Bluestone our new producer has been running a very active work over program, consistent with what we are seeing from other producers in the Barnett as well these very inexpensive work over programs are high return, expenses for the producers. And we are continuing to see volumes over and above our estimates work over program led to a 4% volume increase over the fourth quarter and the first quarter.”

As we saw before, financial distress for an E&P company need not lead to production cuts, but can instead result in a more efficient owners maintaining or even growing output.

.avia-image-container.av-34ahrp-d3fb1c93622d43d8ae36d5cf65d2b894 img.avia_image{ box-shadow:none; } .avia-image-container.av-34ahrp-d3fb1c93622d43d8ae36d5cf65d2b894 .av-image-caption-overlay-center{ color:#ffffff; }

The oil futures curve provides an interesting perspective. Falling MLP prices suggest lower crude prices will ultimately cut shale output and reduce the use of existing and planned infrastructure. But in fact deferred futures contracts have fallen farther, which only makes sense if the market expects shale output in 4-5 years time to continue being an important source of supply. If the prospects for the shale industry were dire, oil traders would bid more for longer term contracts expecting to profit from ultimately less U.S. production. But in fact they’re doing the opposite, suggesting oil traders wouldn’t short the U.S. shale industry.

Predicting the short term moves in MLPs will inevitably require being an oil trader. Your weekly blogger cannot change that. But studying the earnings reports,  transcripts and futures market over the last couple of weeks does offer a more granular perspective on the many positive developments taking place in U.S. shale.

We are invested in CEQP, ENLC (GP of ENLK) and WGP (GP of WES)